First, search for and open EC2.
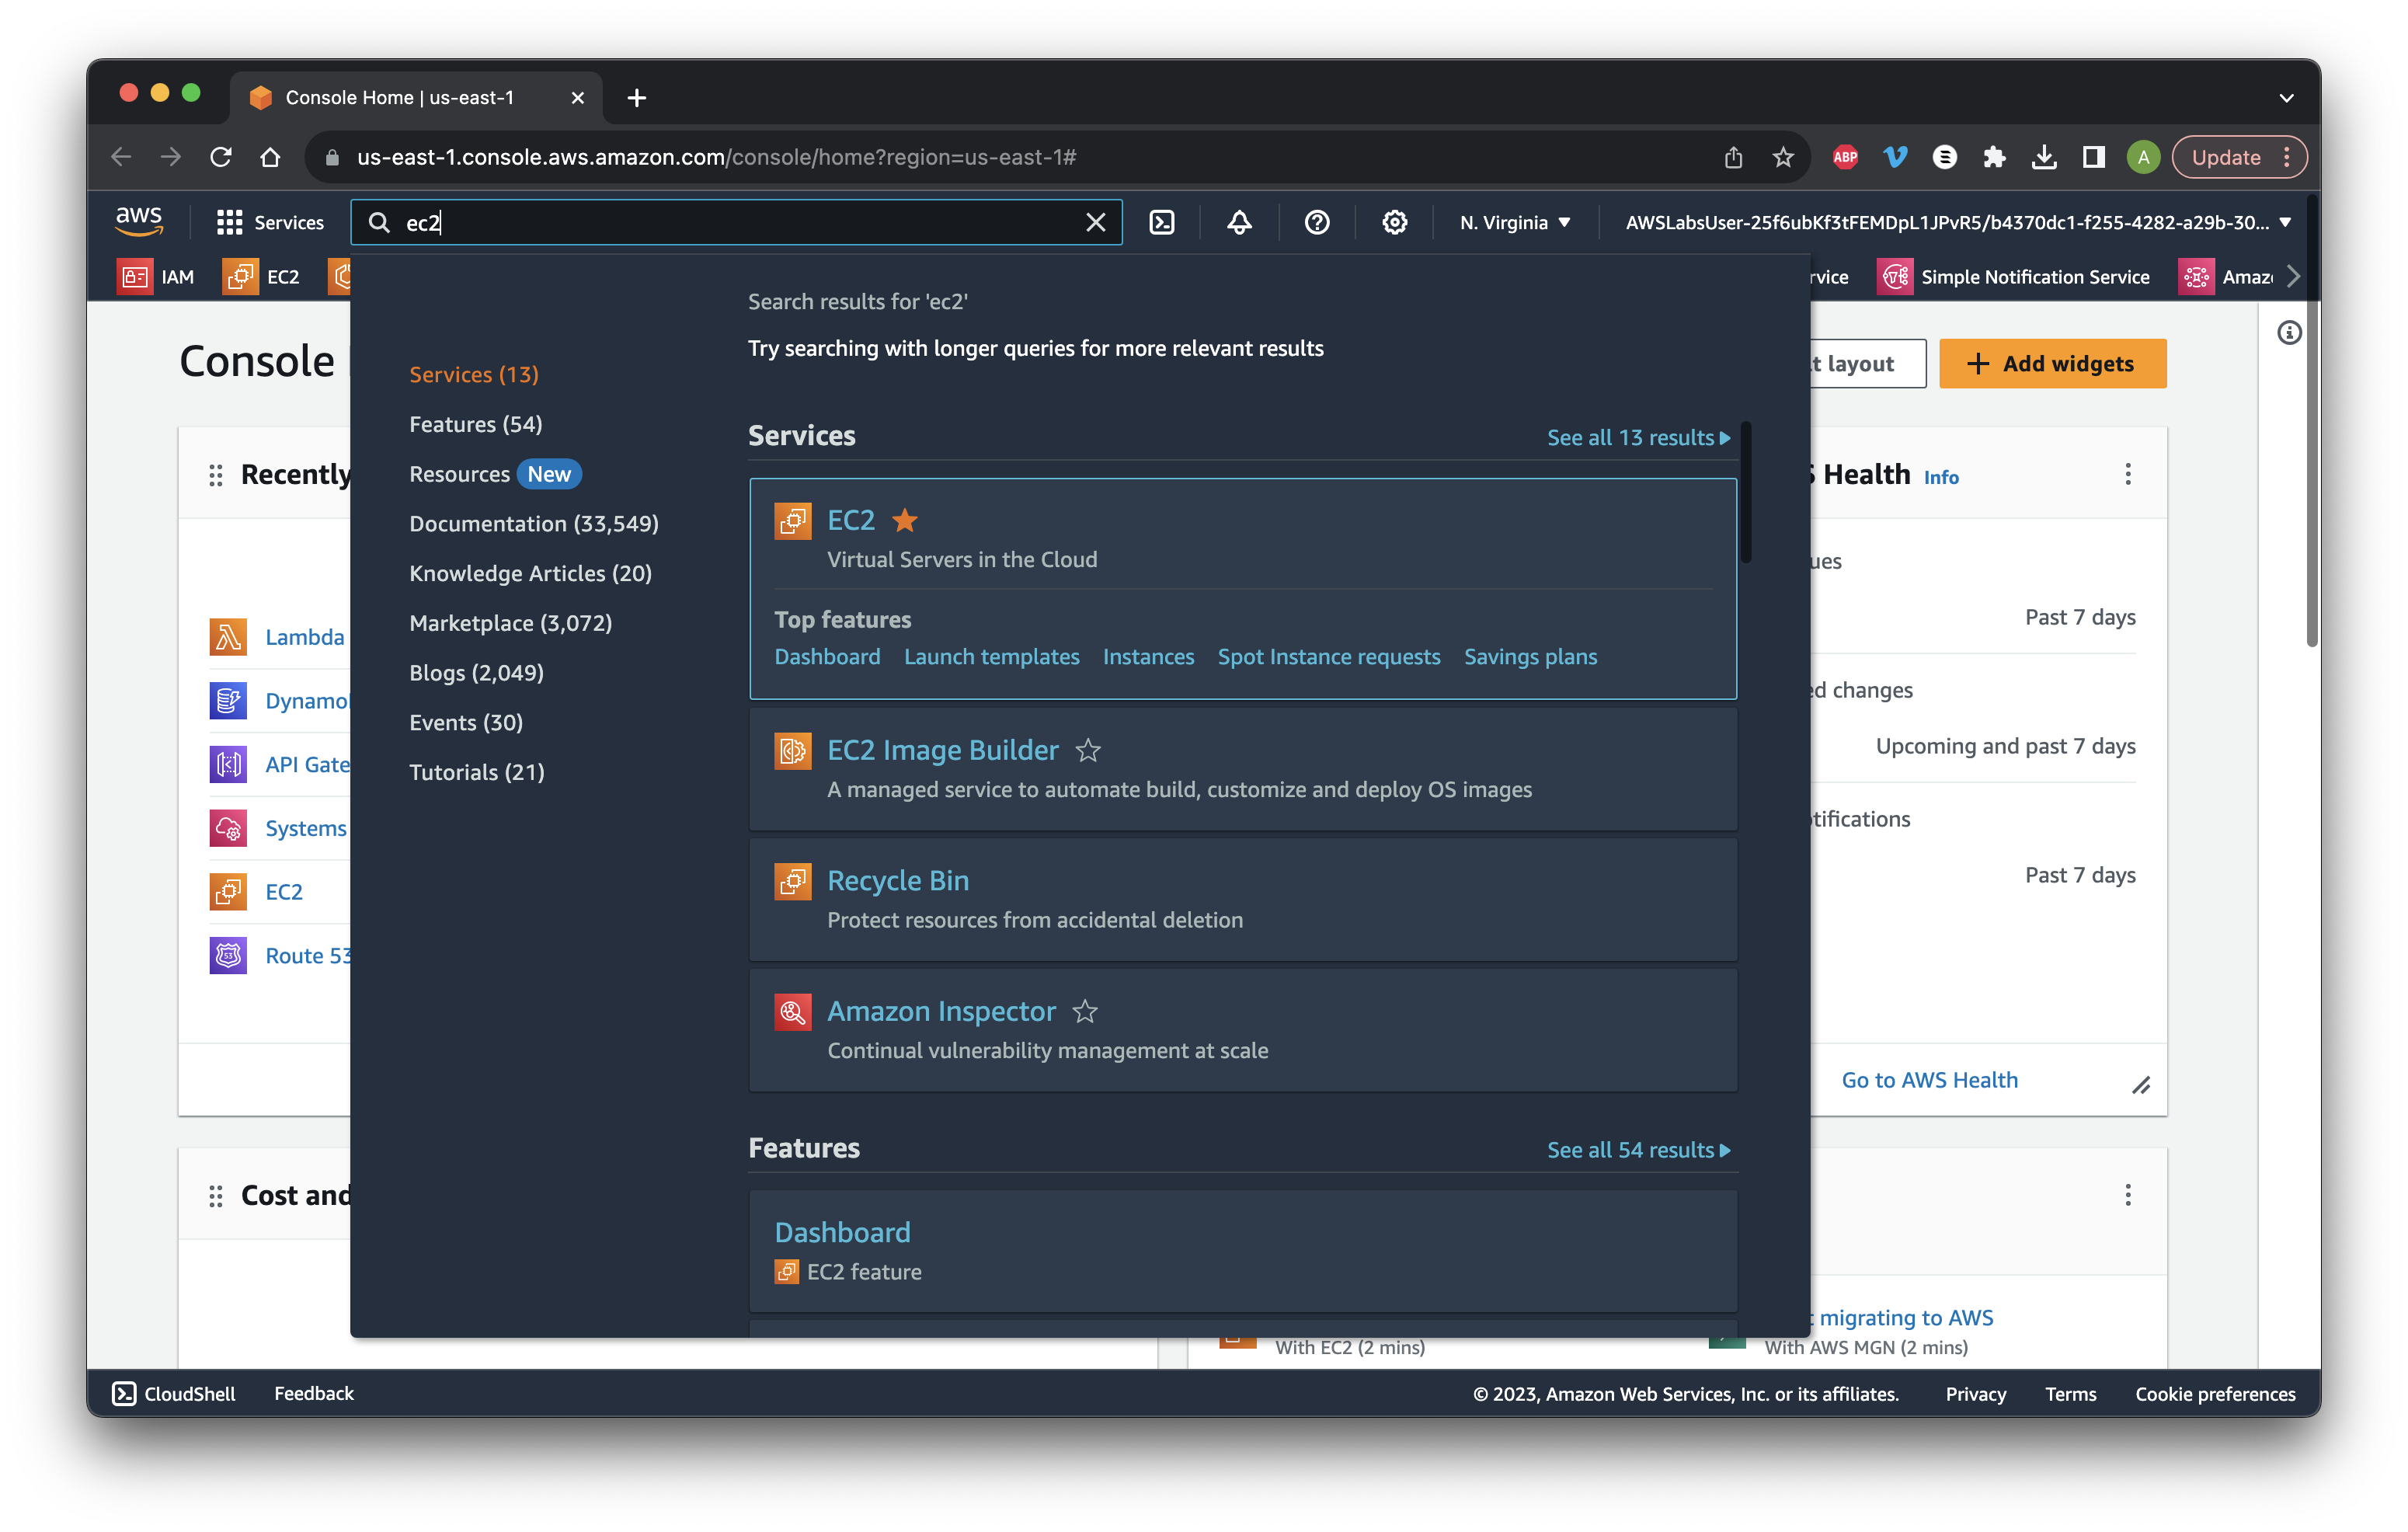
First, search for and open EC2.
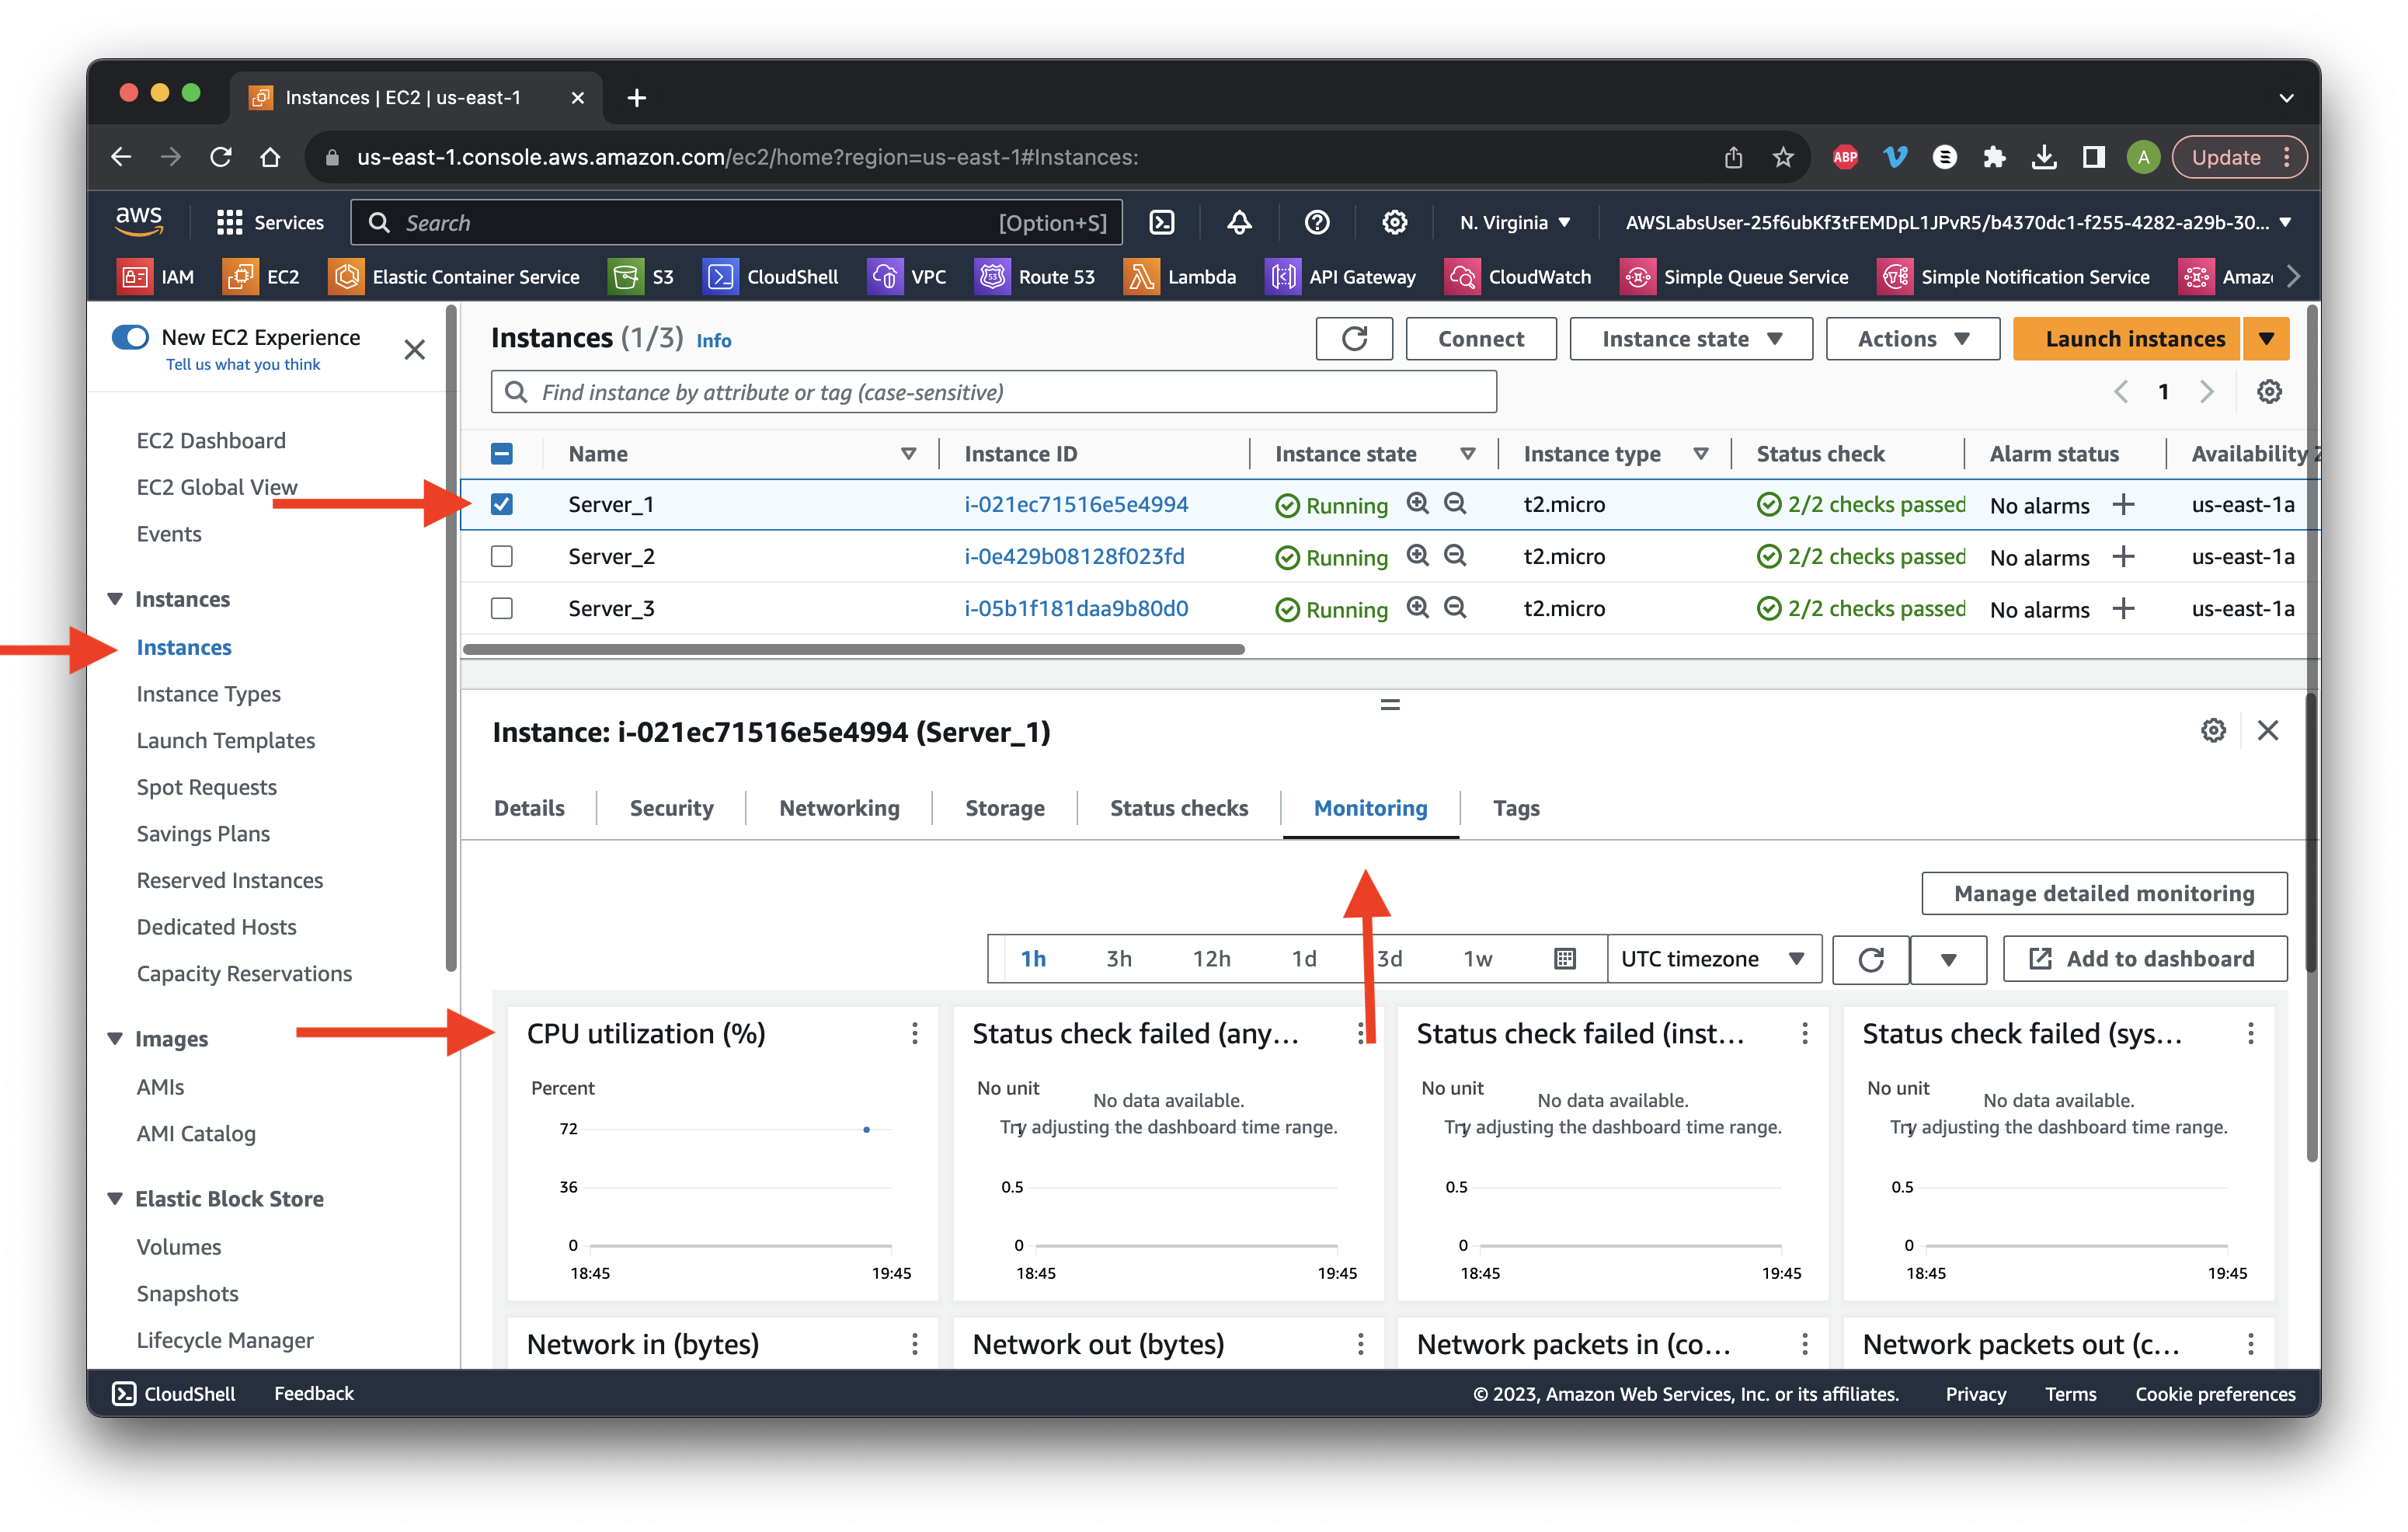
Select Instances and choose the check box for Server_1. Click the Monitoring tab and review the CPU utilization.
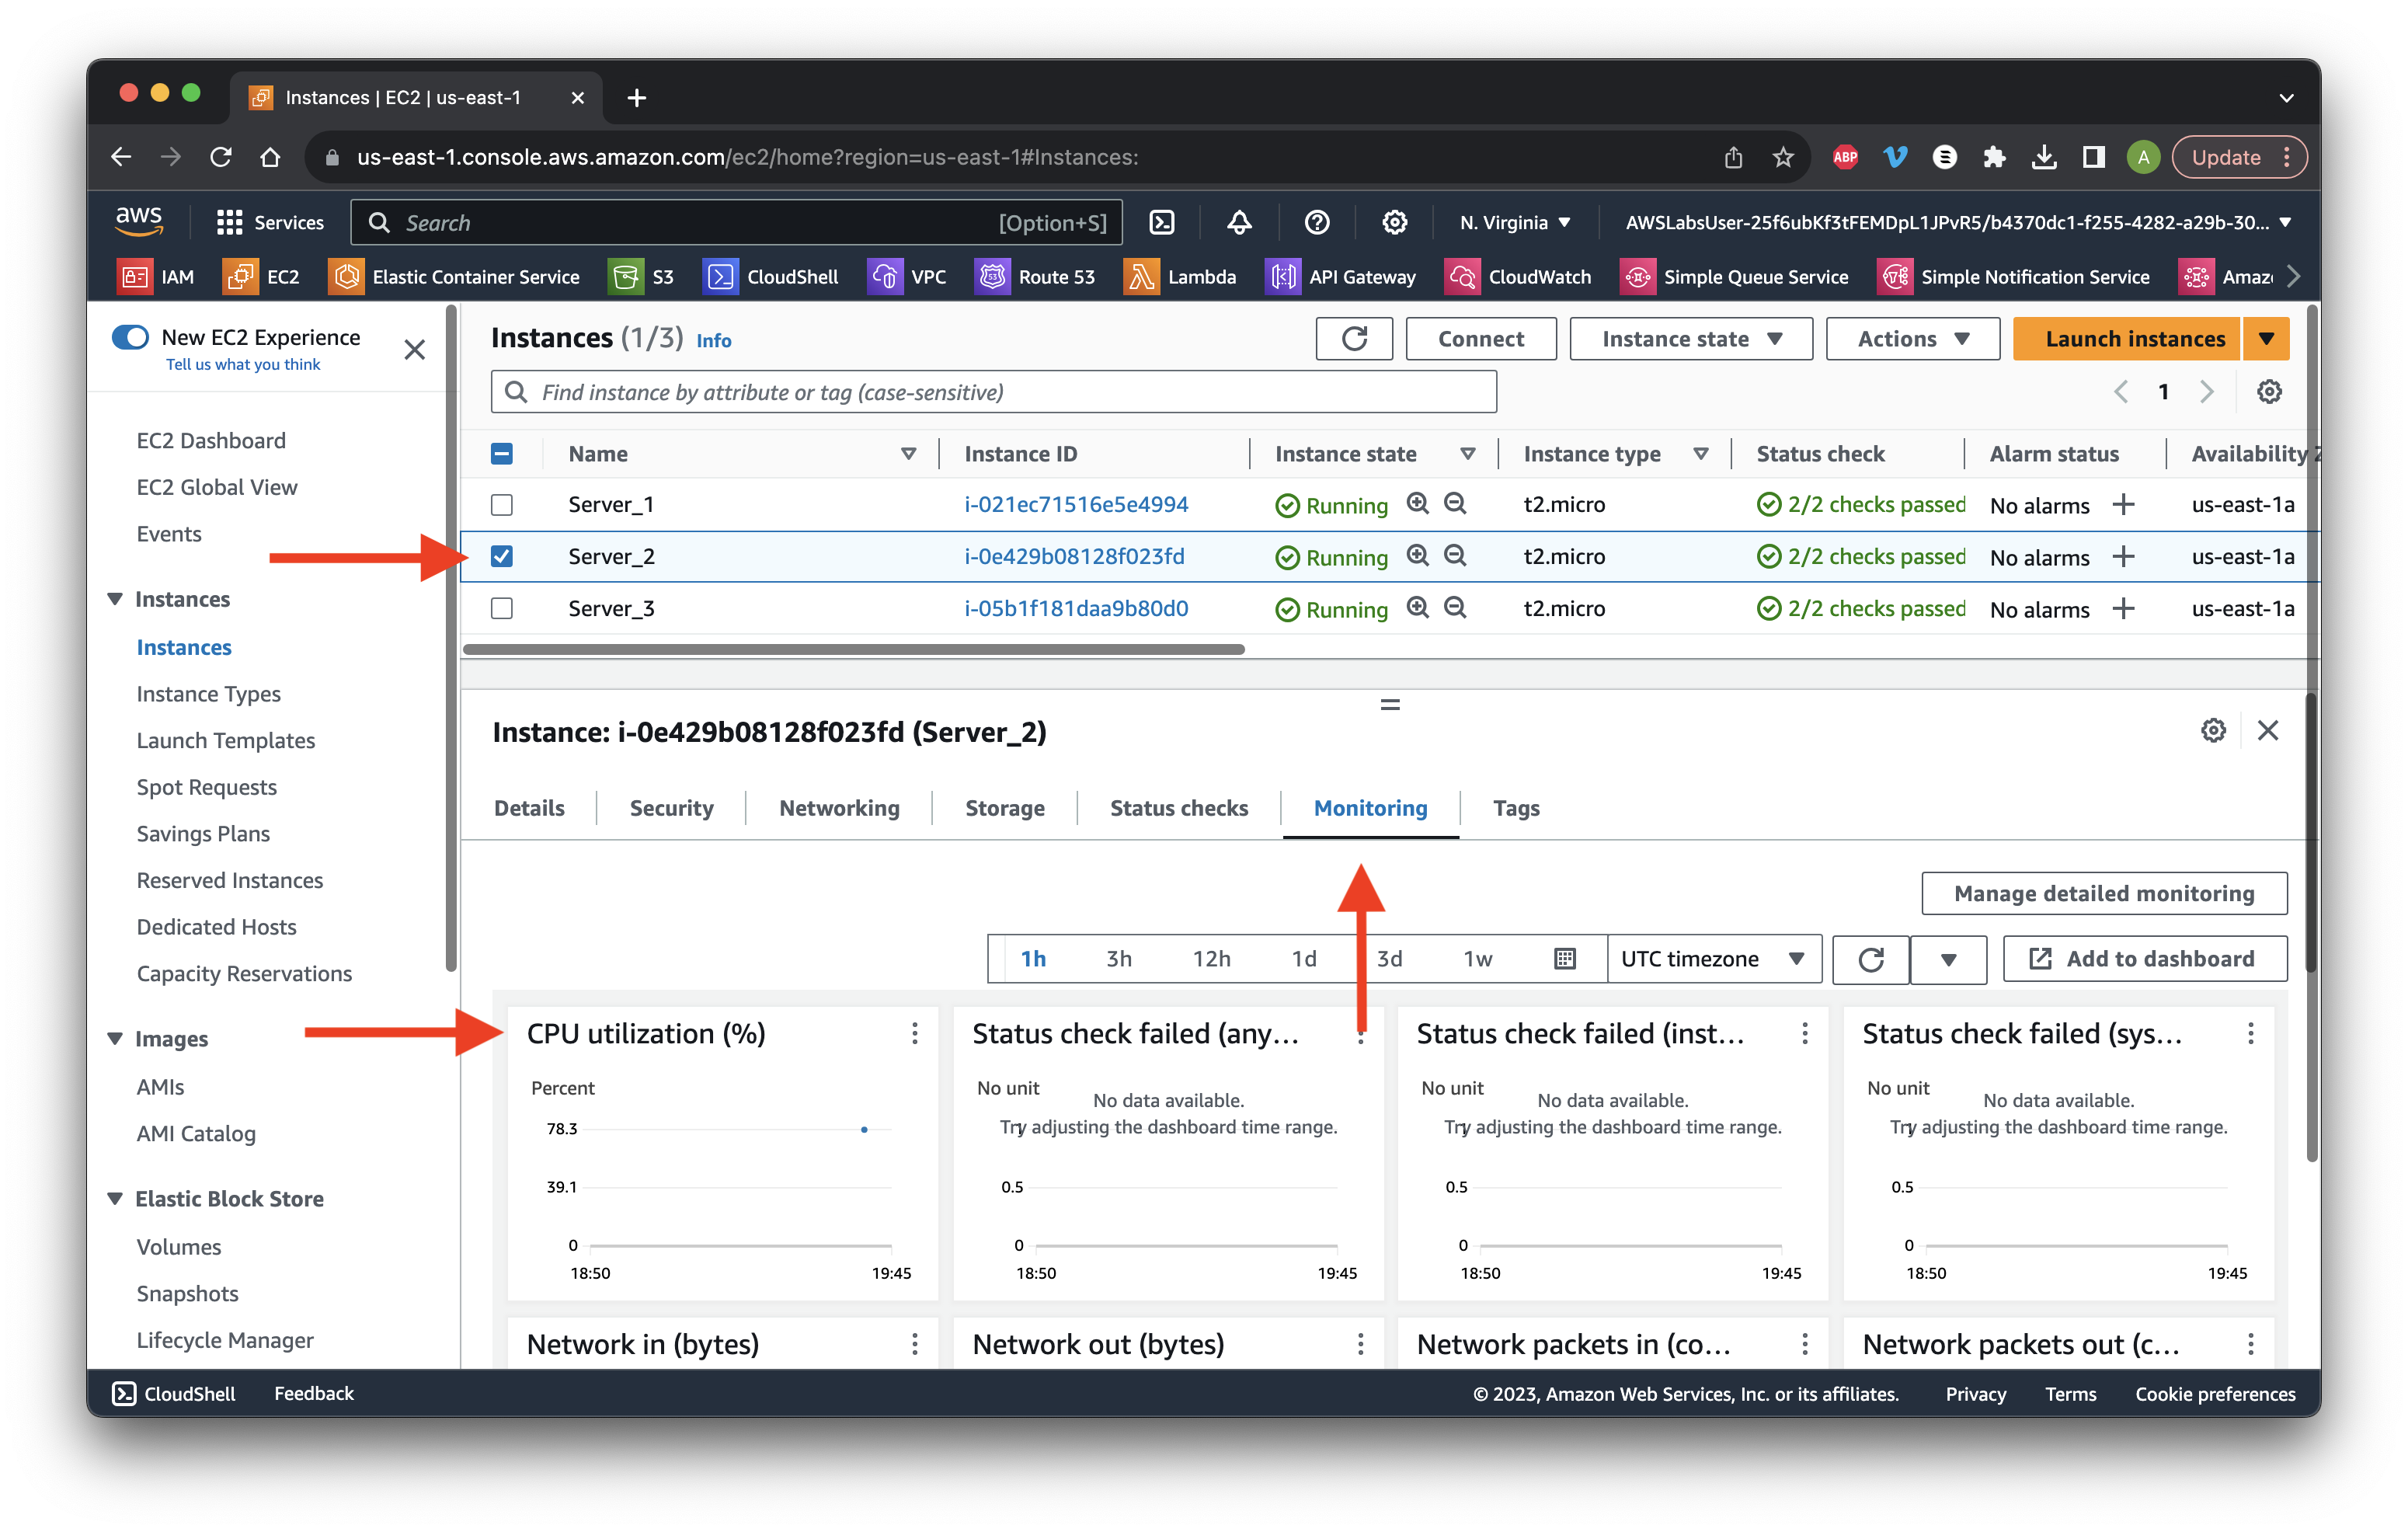
Uncheck the box for Server_1 and repeat the above steps for Server_2 and Server_3.
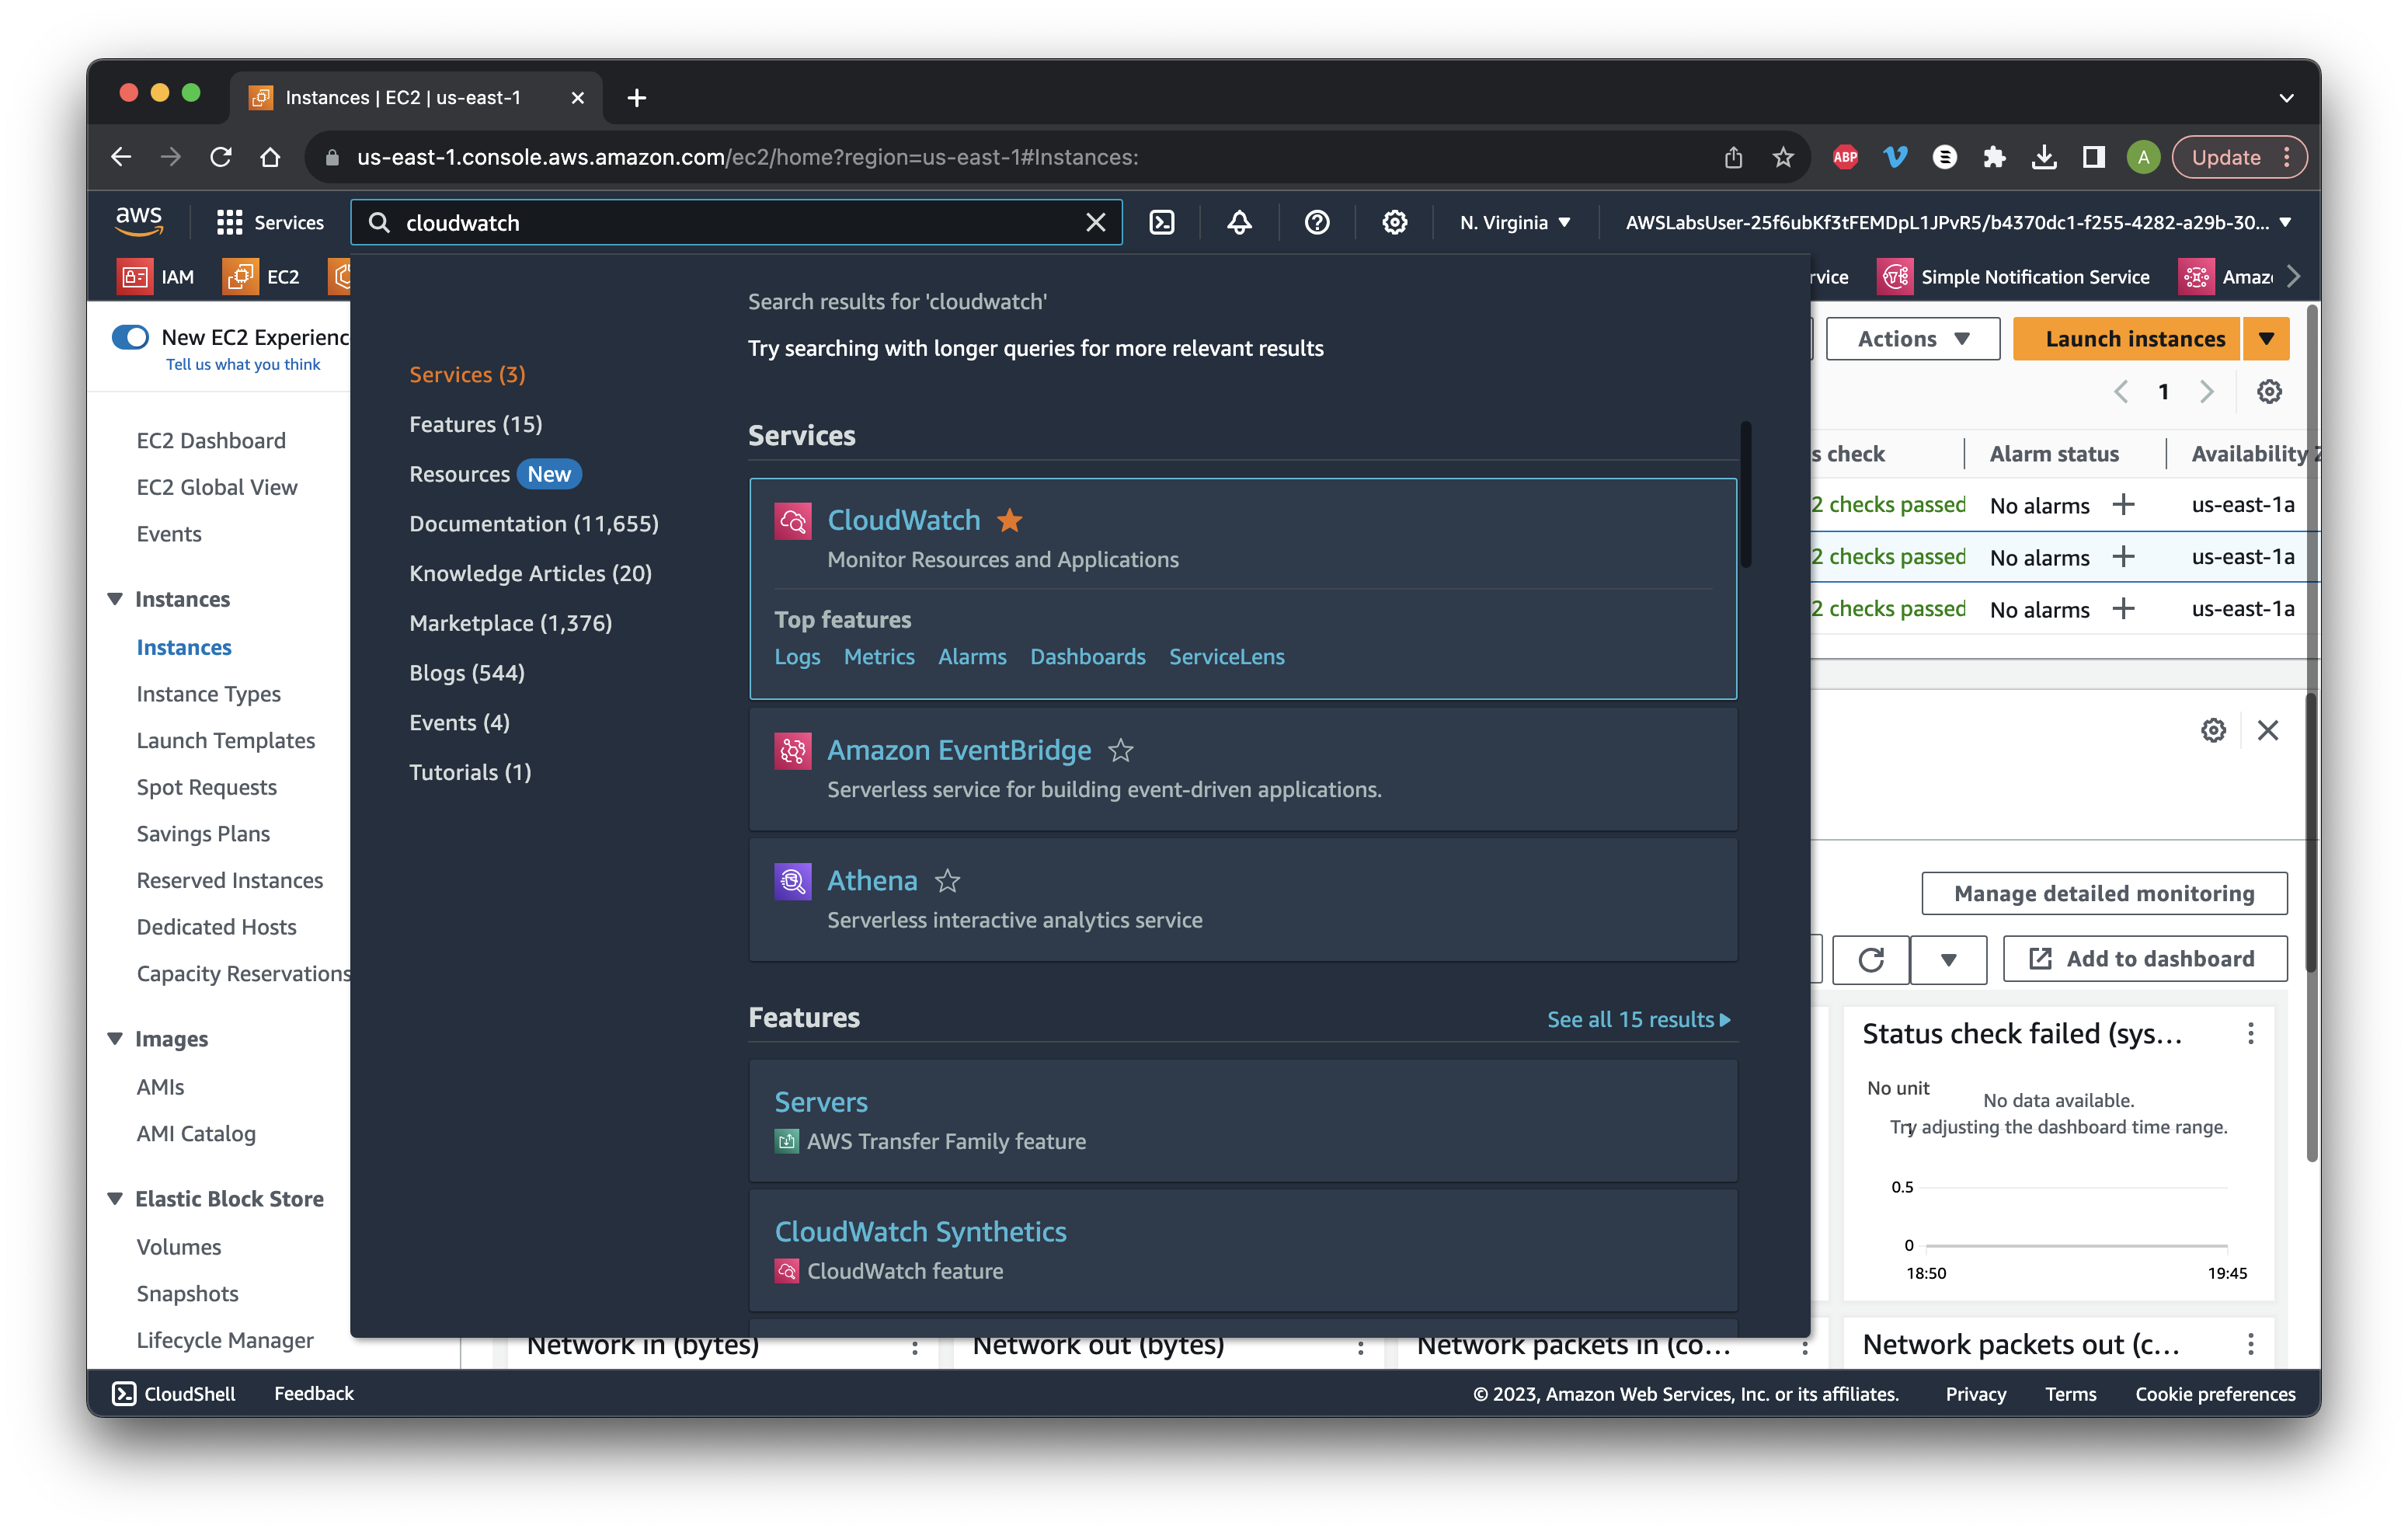
Search for and open CloudWatch.
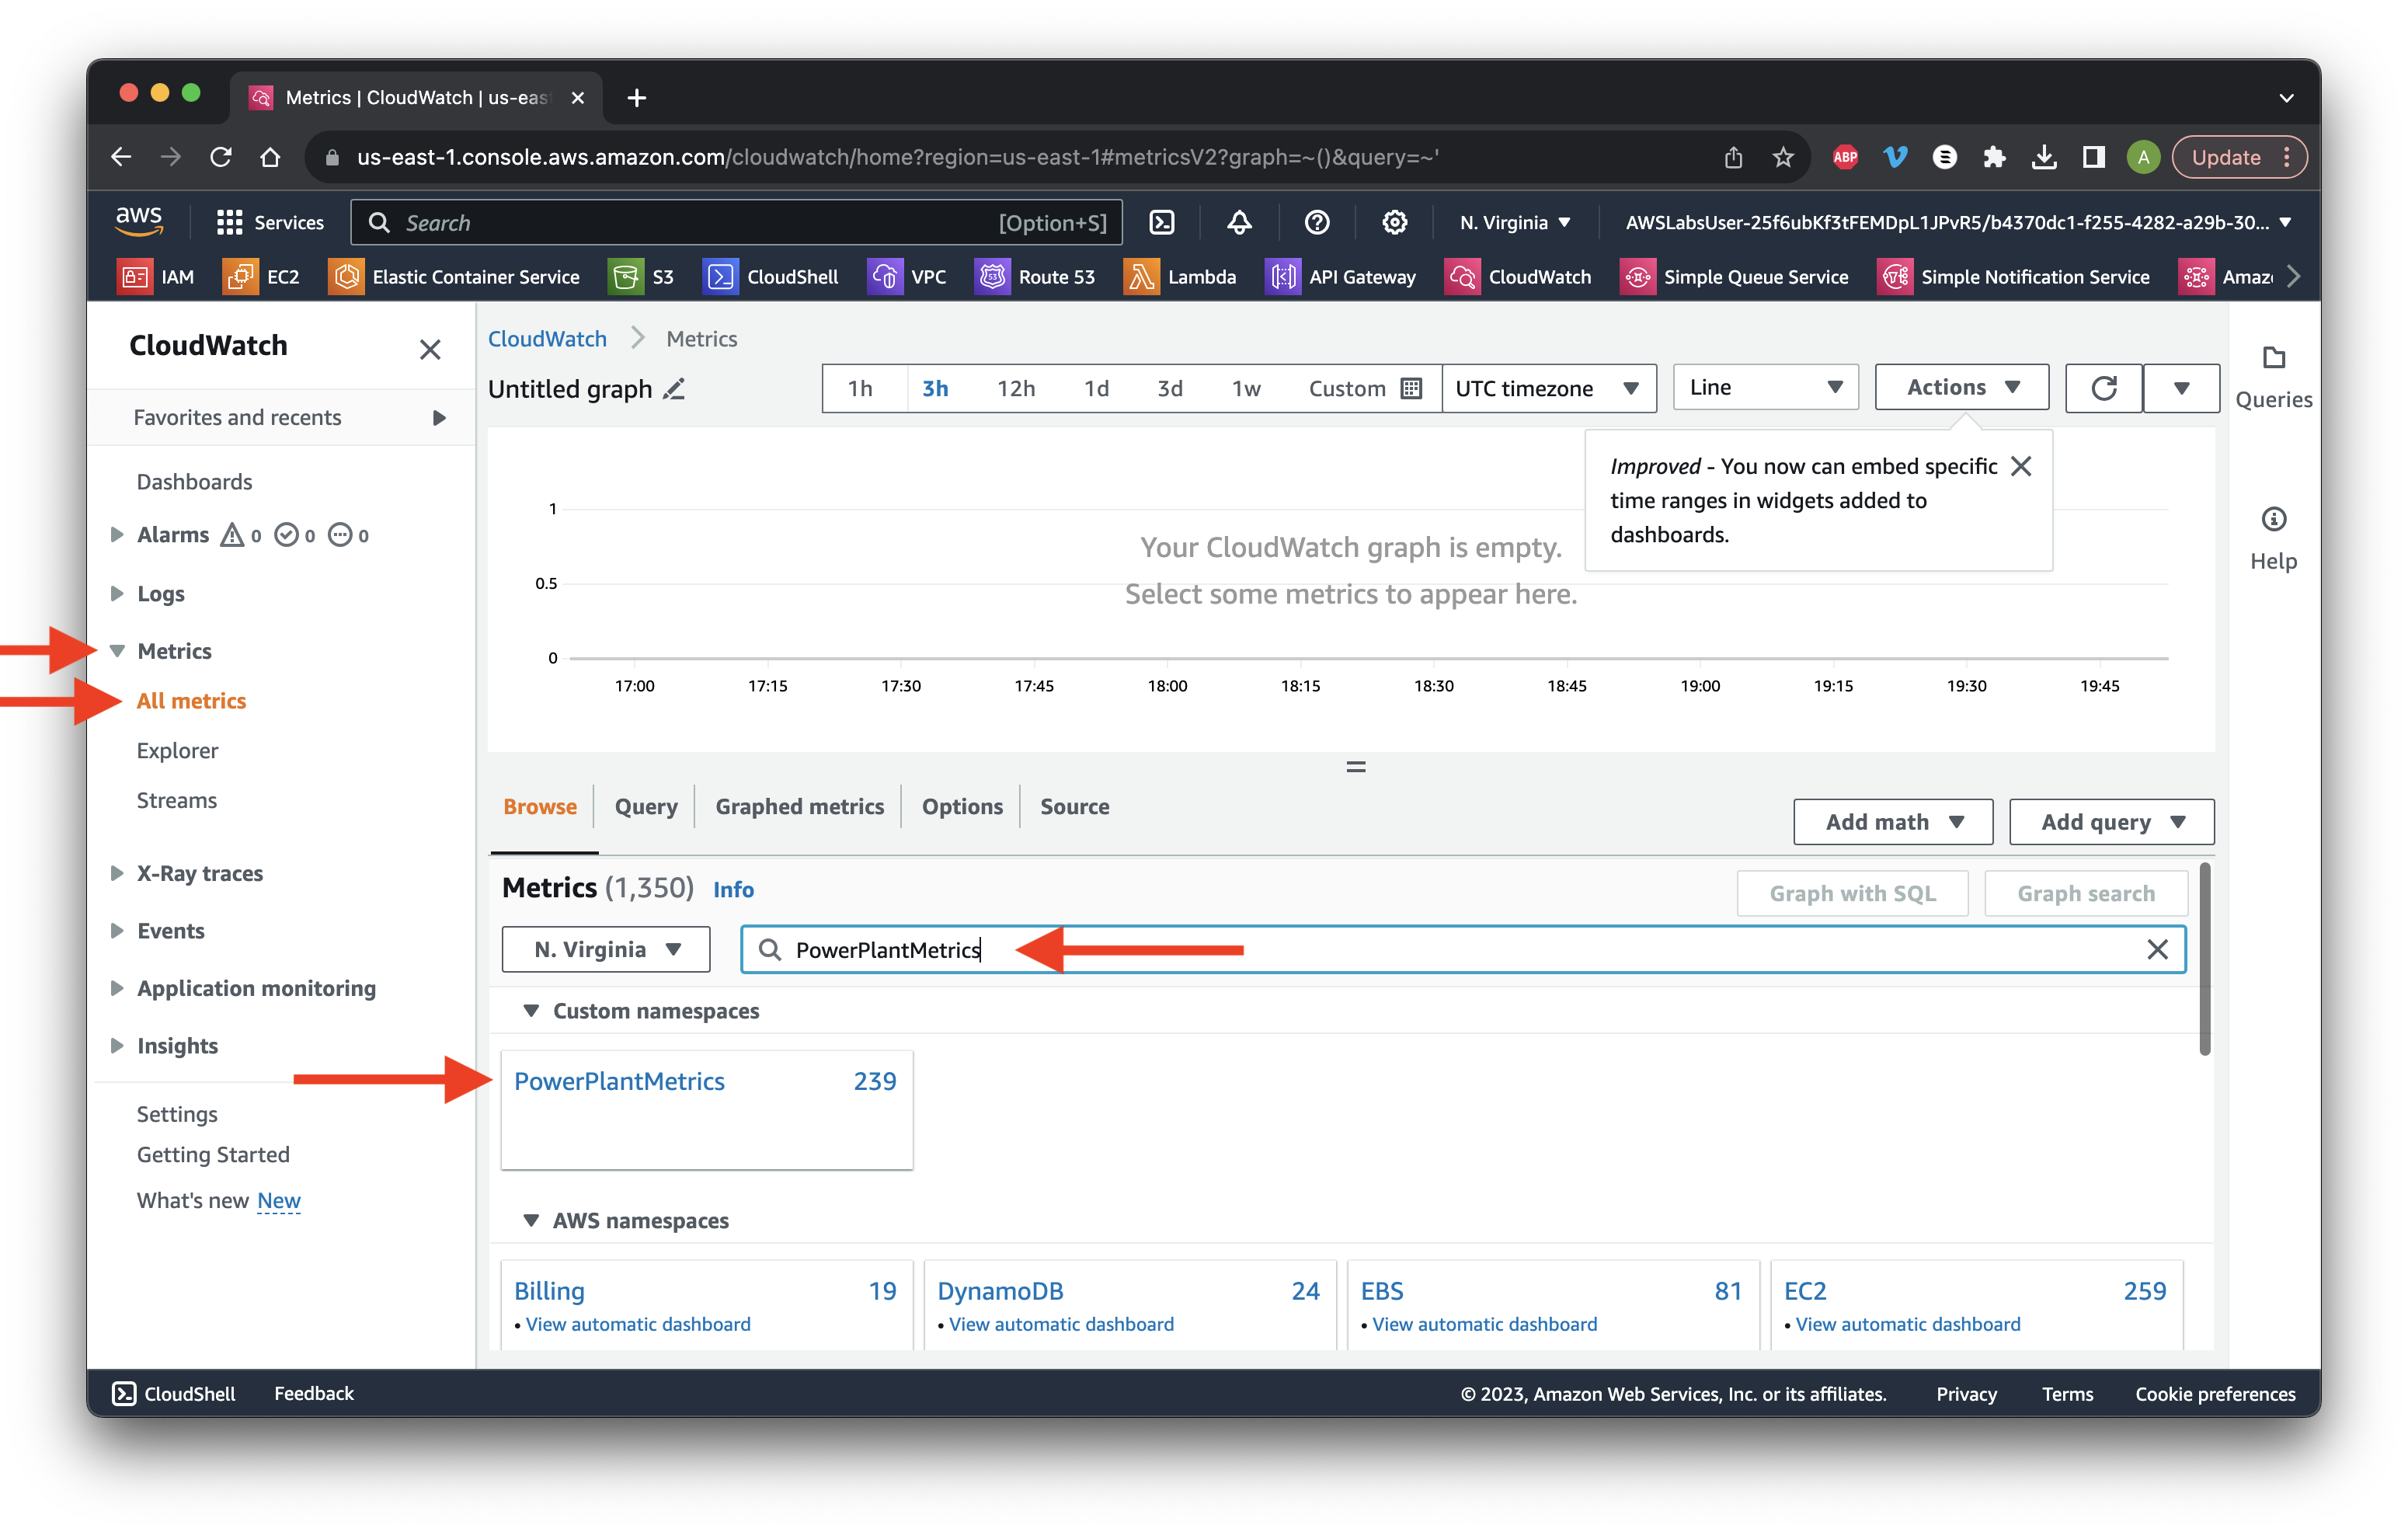
Select the Metrics dropdown then All metrics. Search for PowerPlantMetrics and click the Custom namespace.
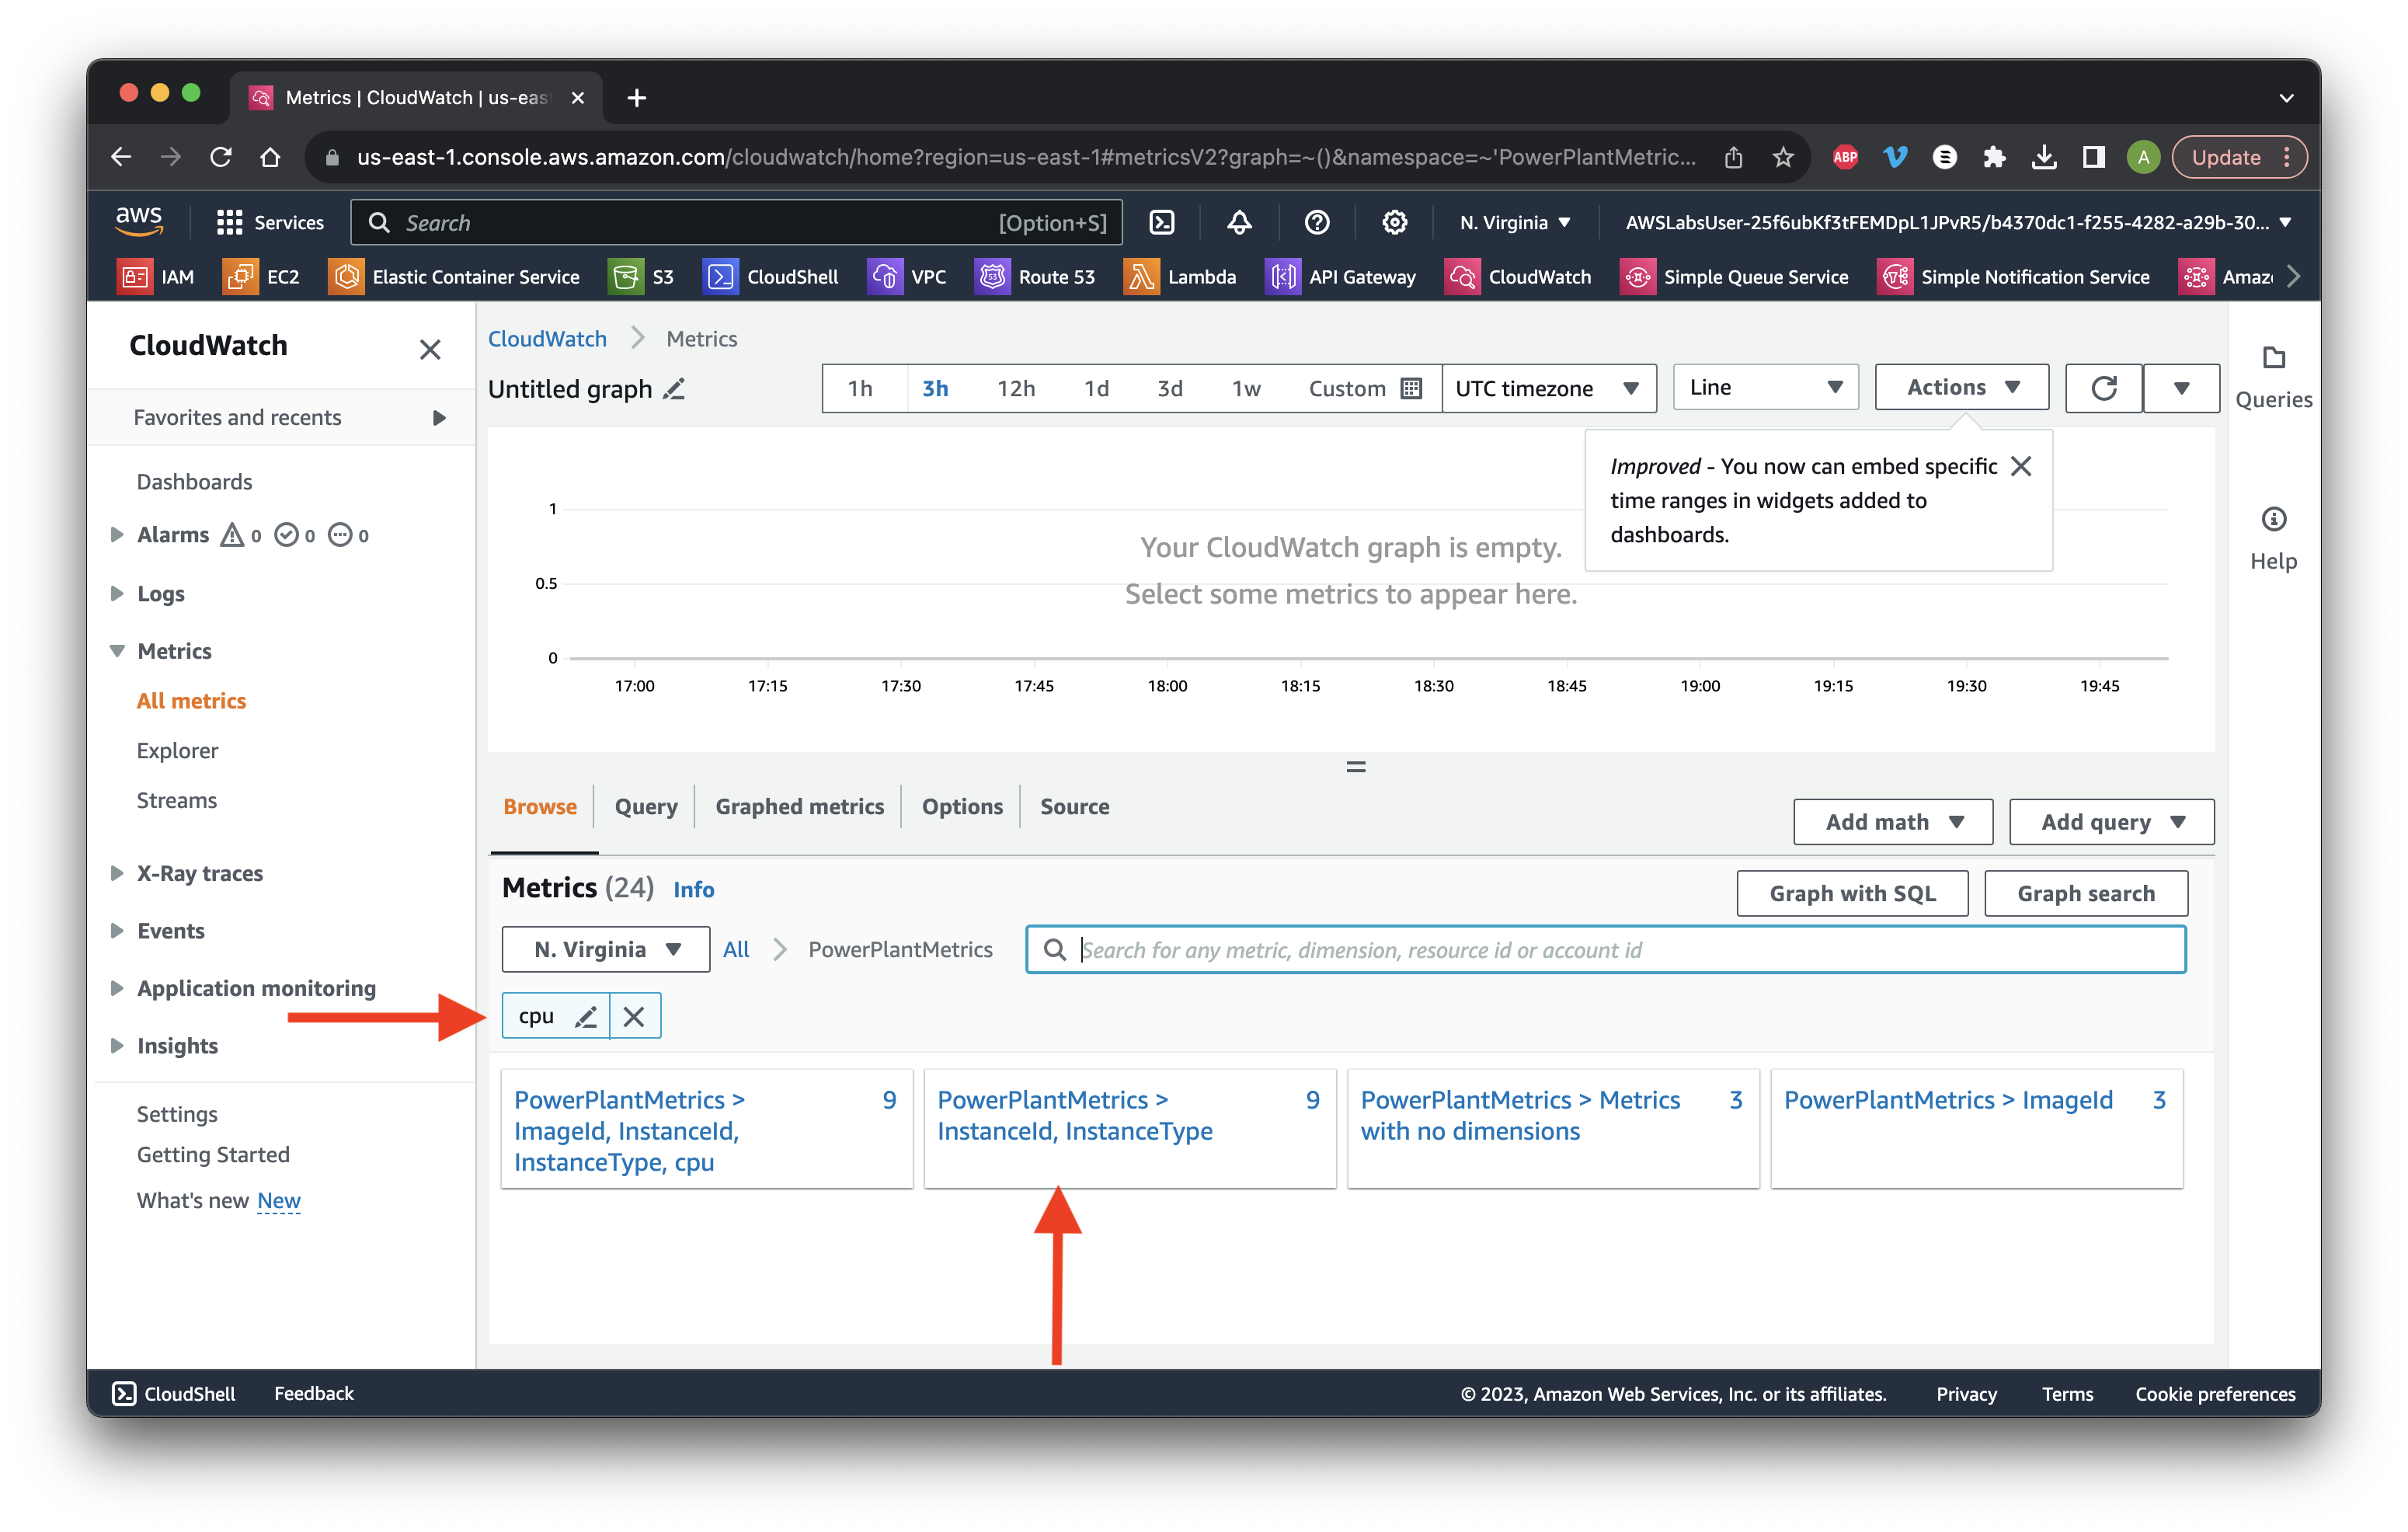
Next search for CPU and select InstanceId, InstanceType.
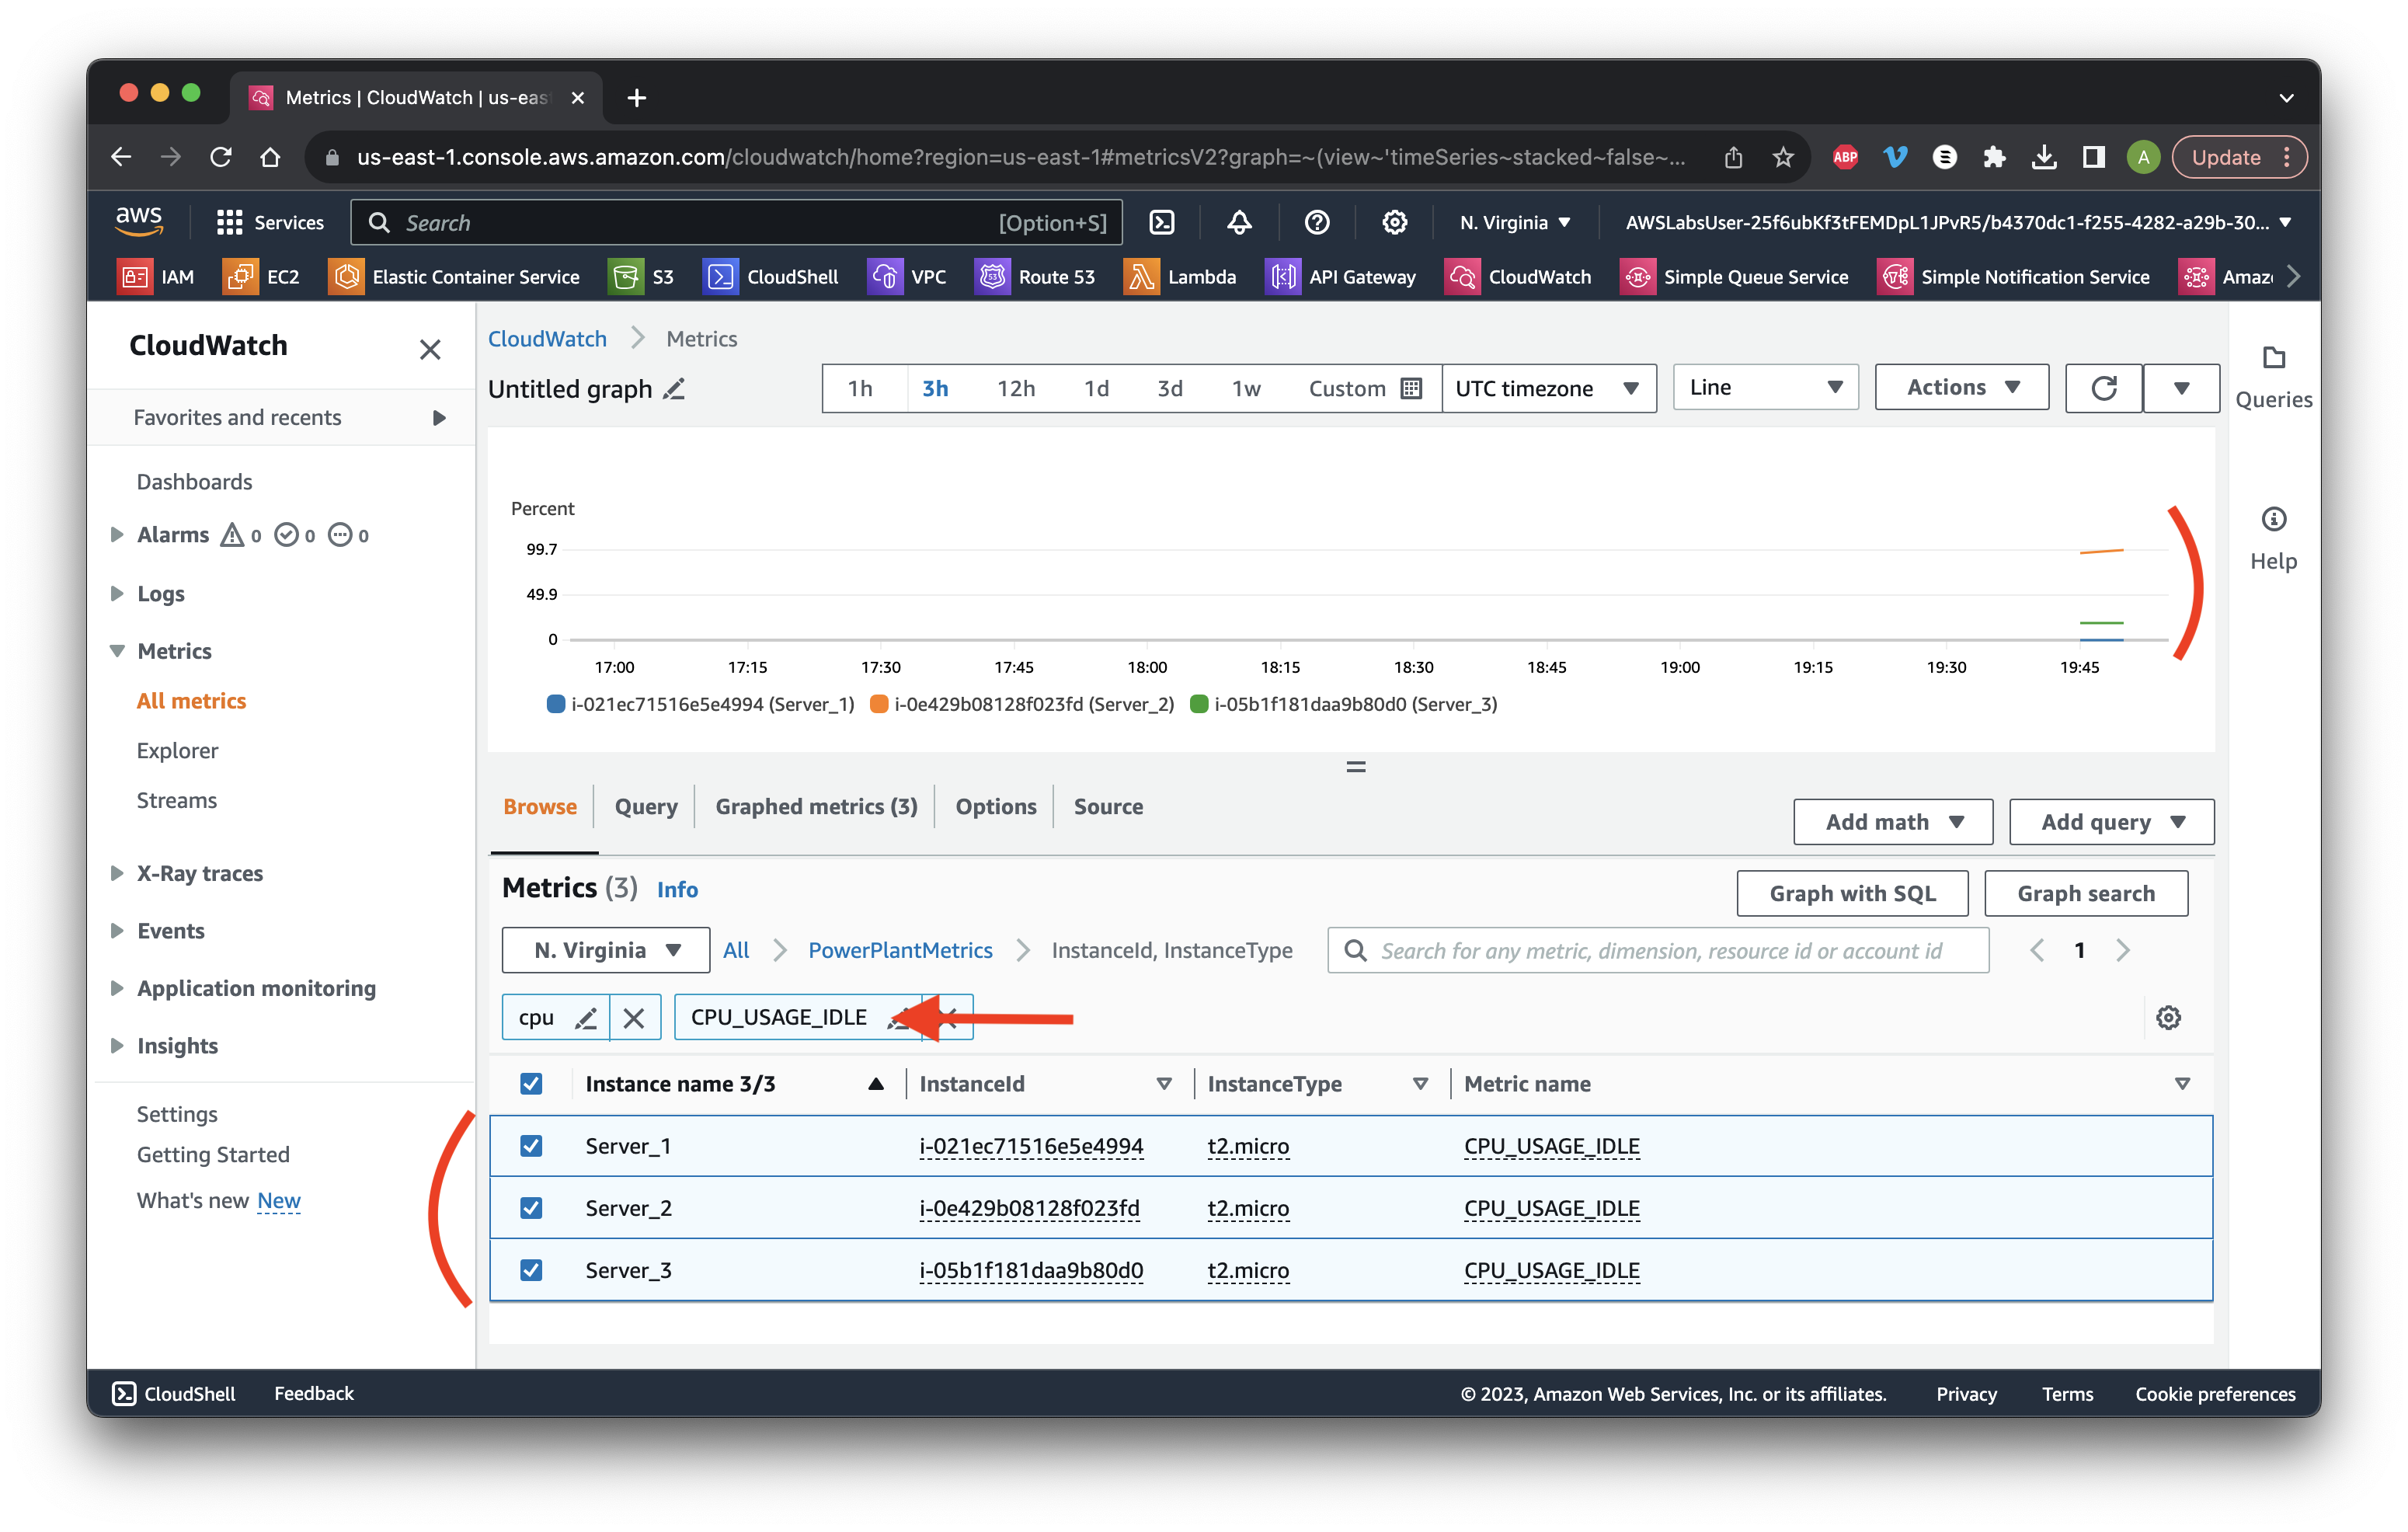
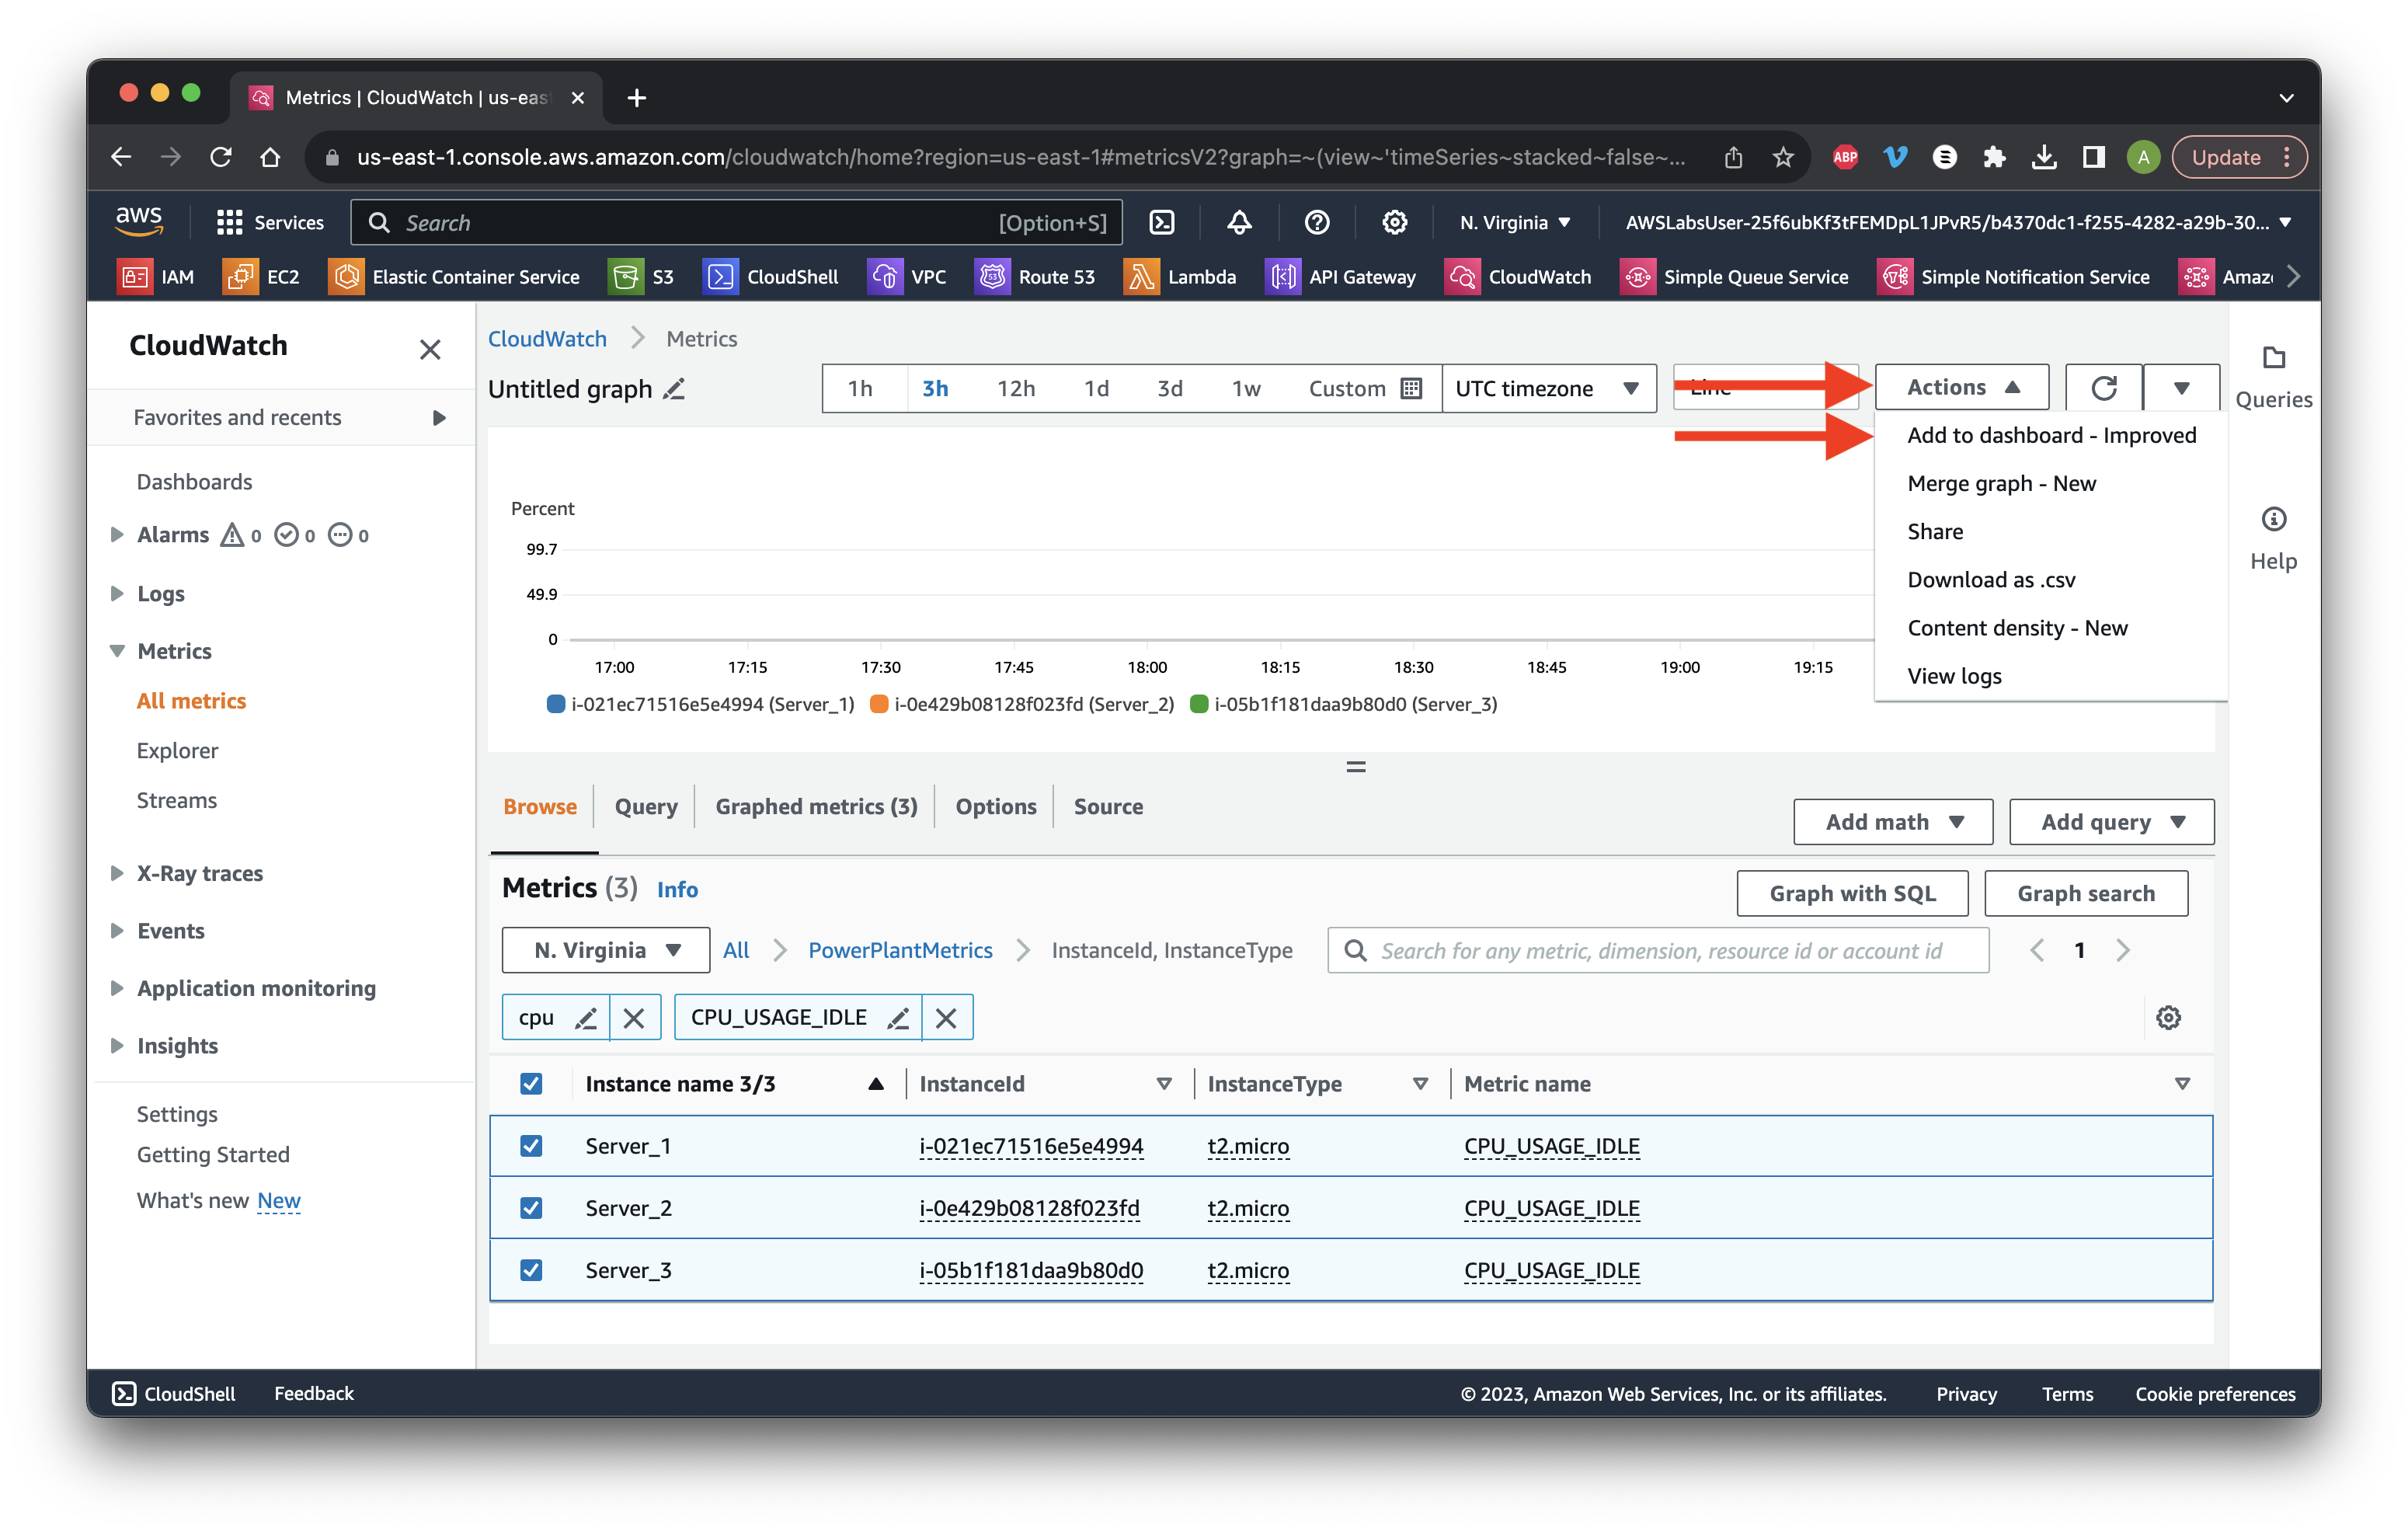
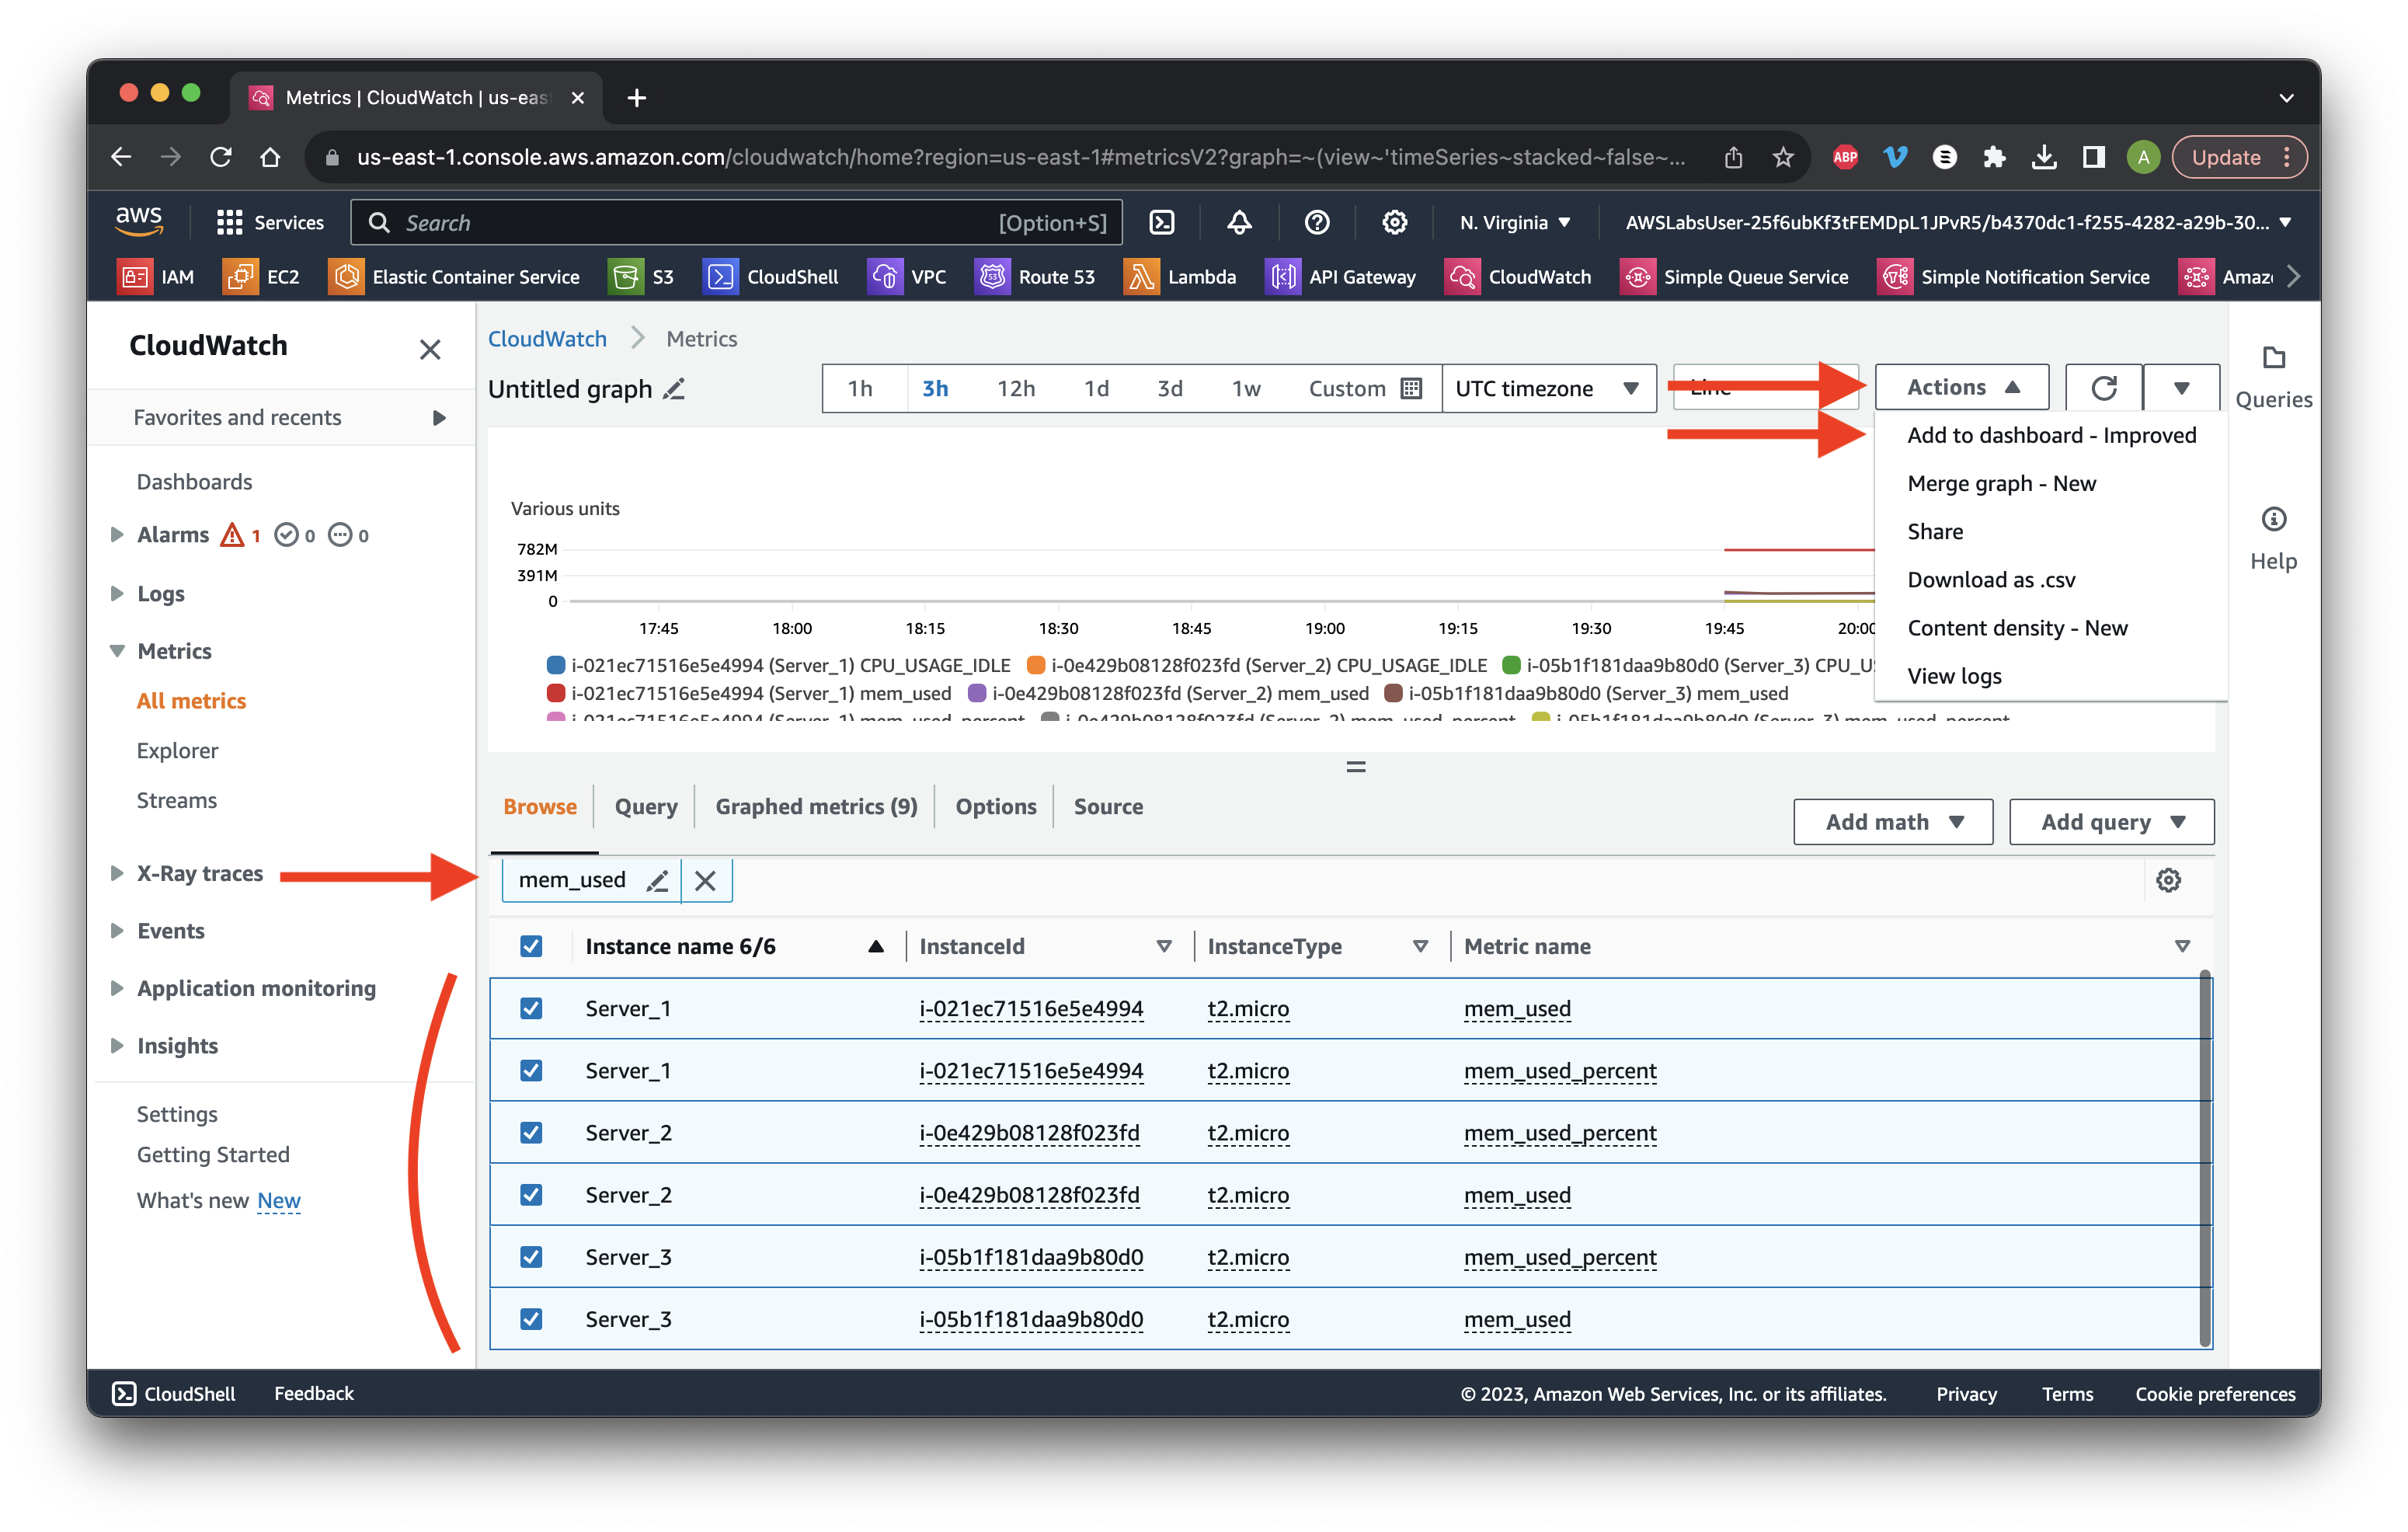
Search for CPU_USAGE_IDLE and select all three check boxes. Review the CPU usage graph.
Click Actions, Add to dashboard - Improved.
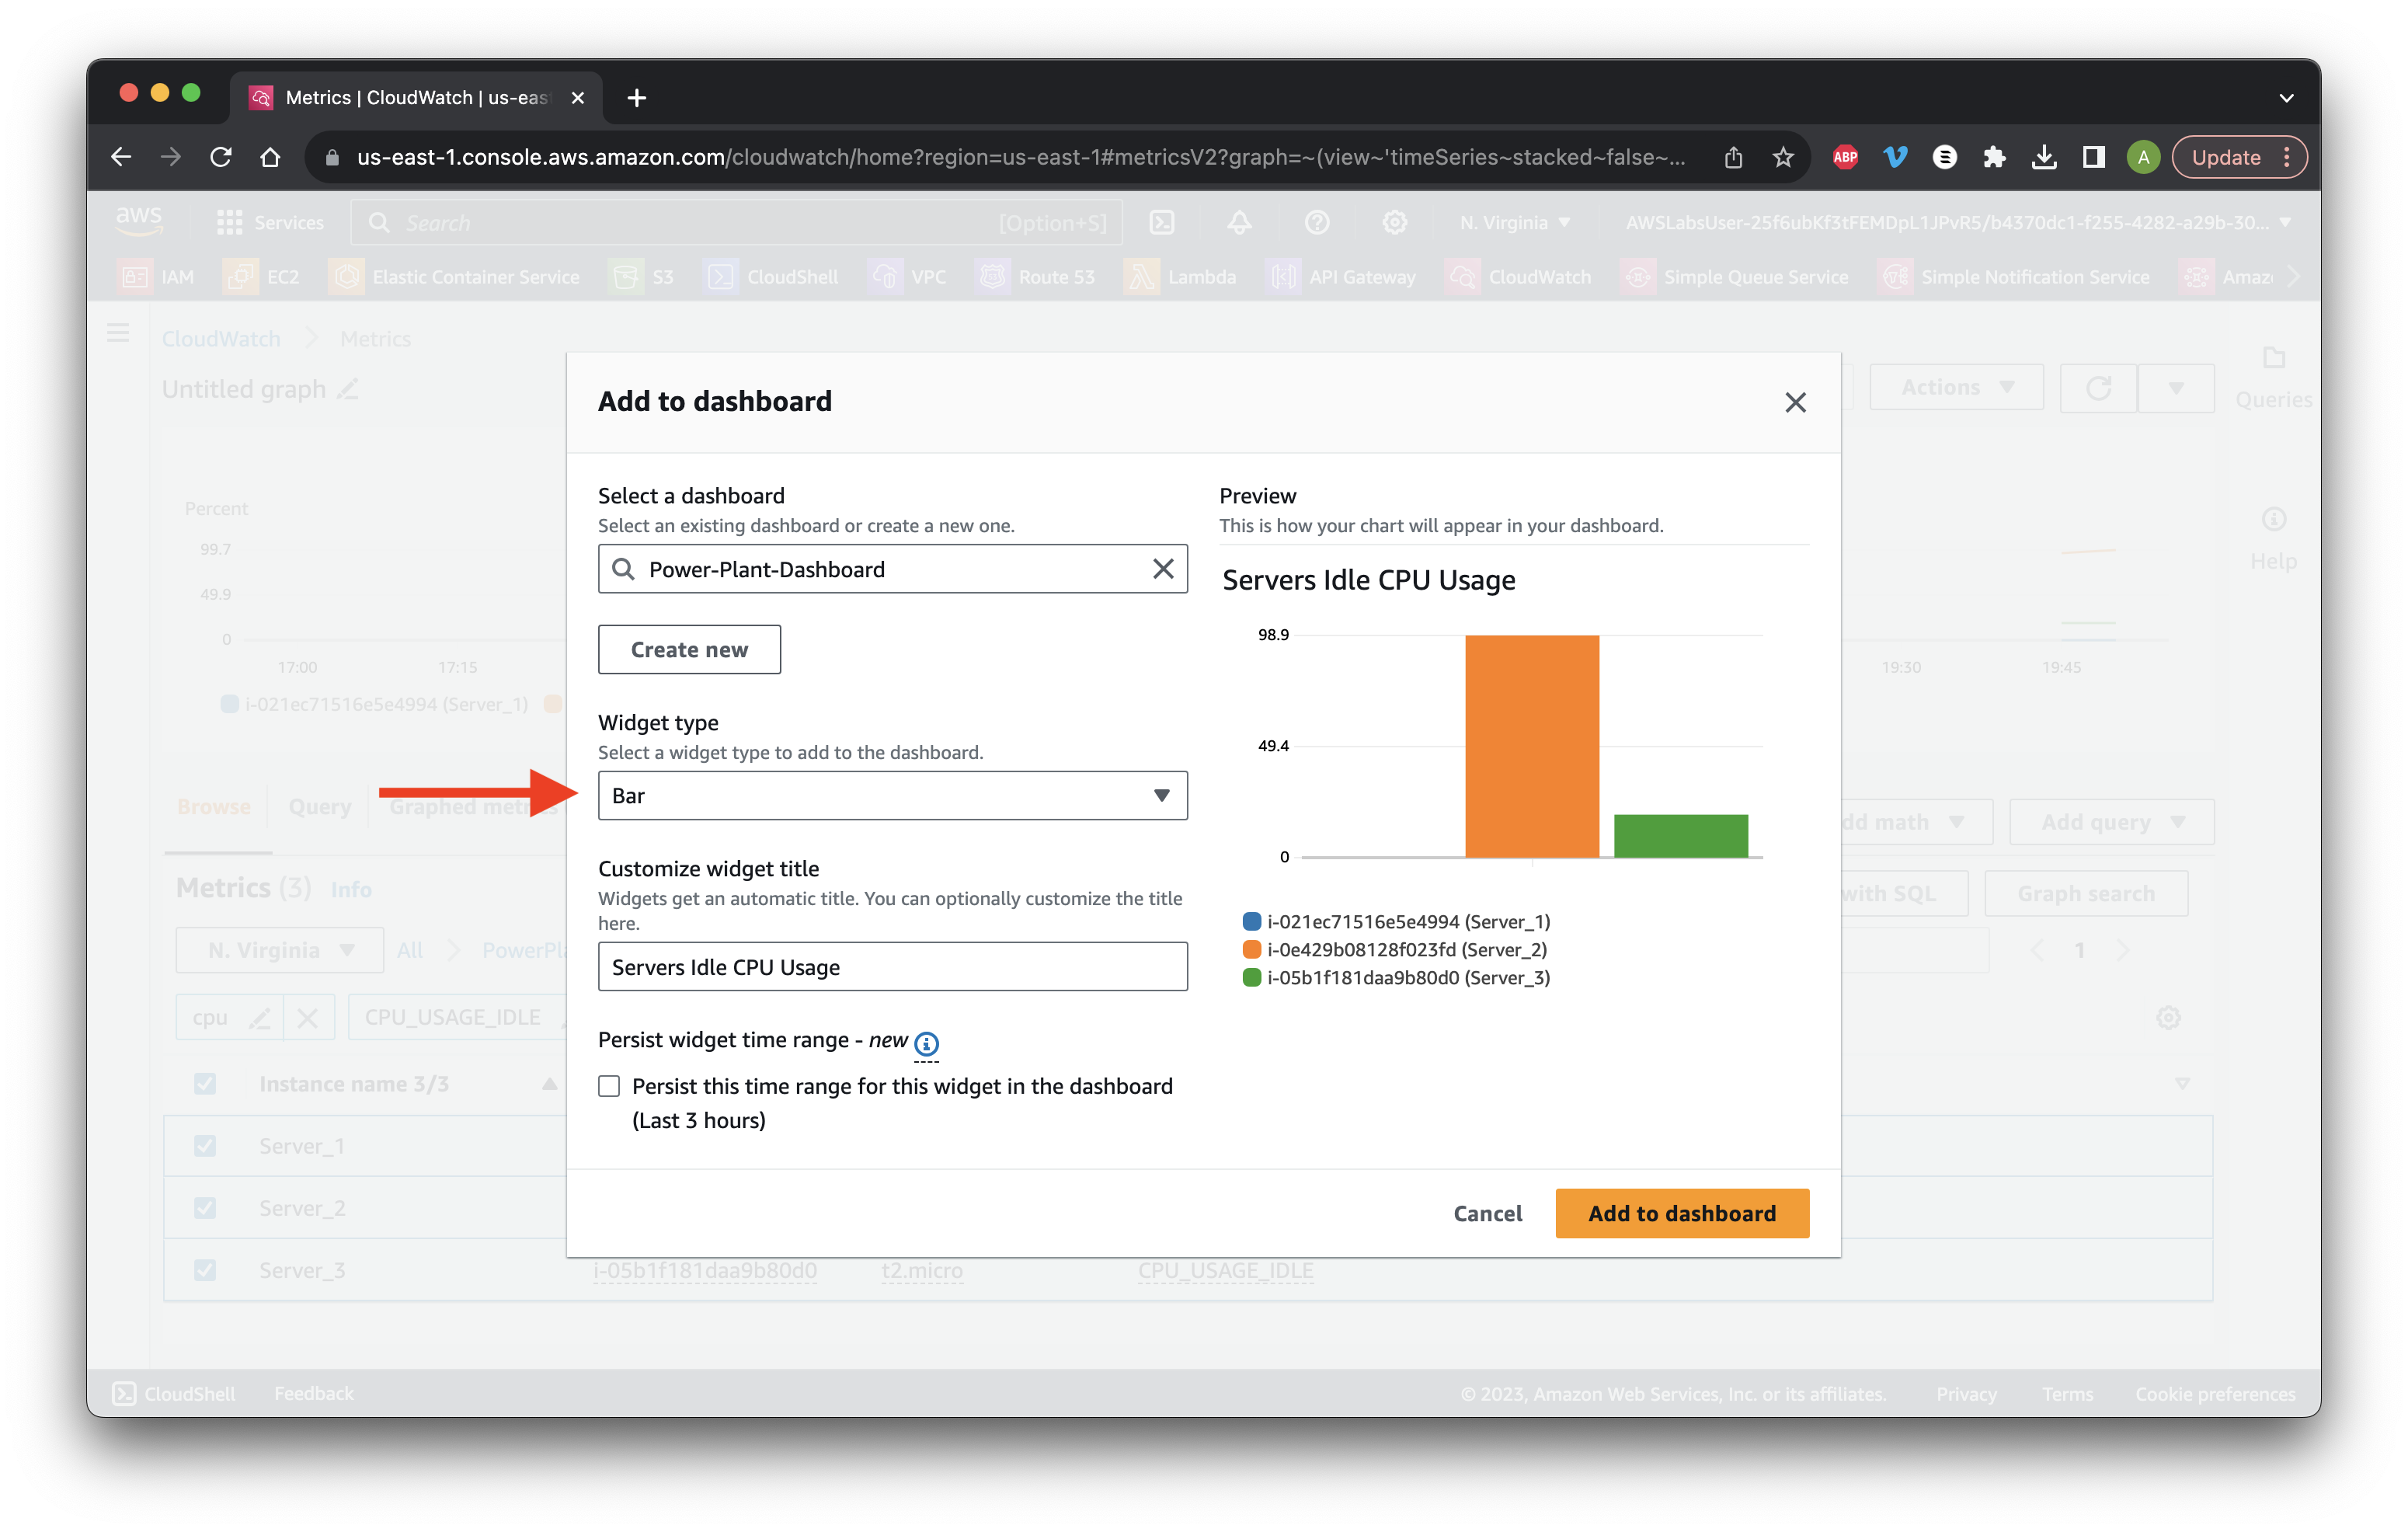
Click Create new. Type Power-Plant-Dashboard and click Create.
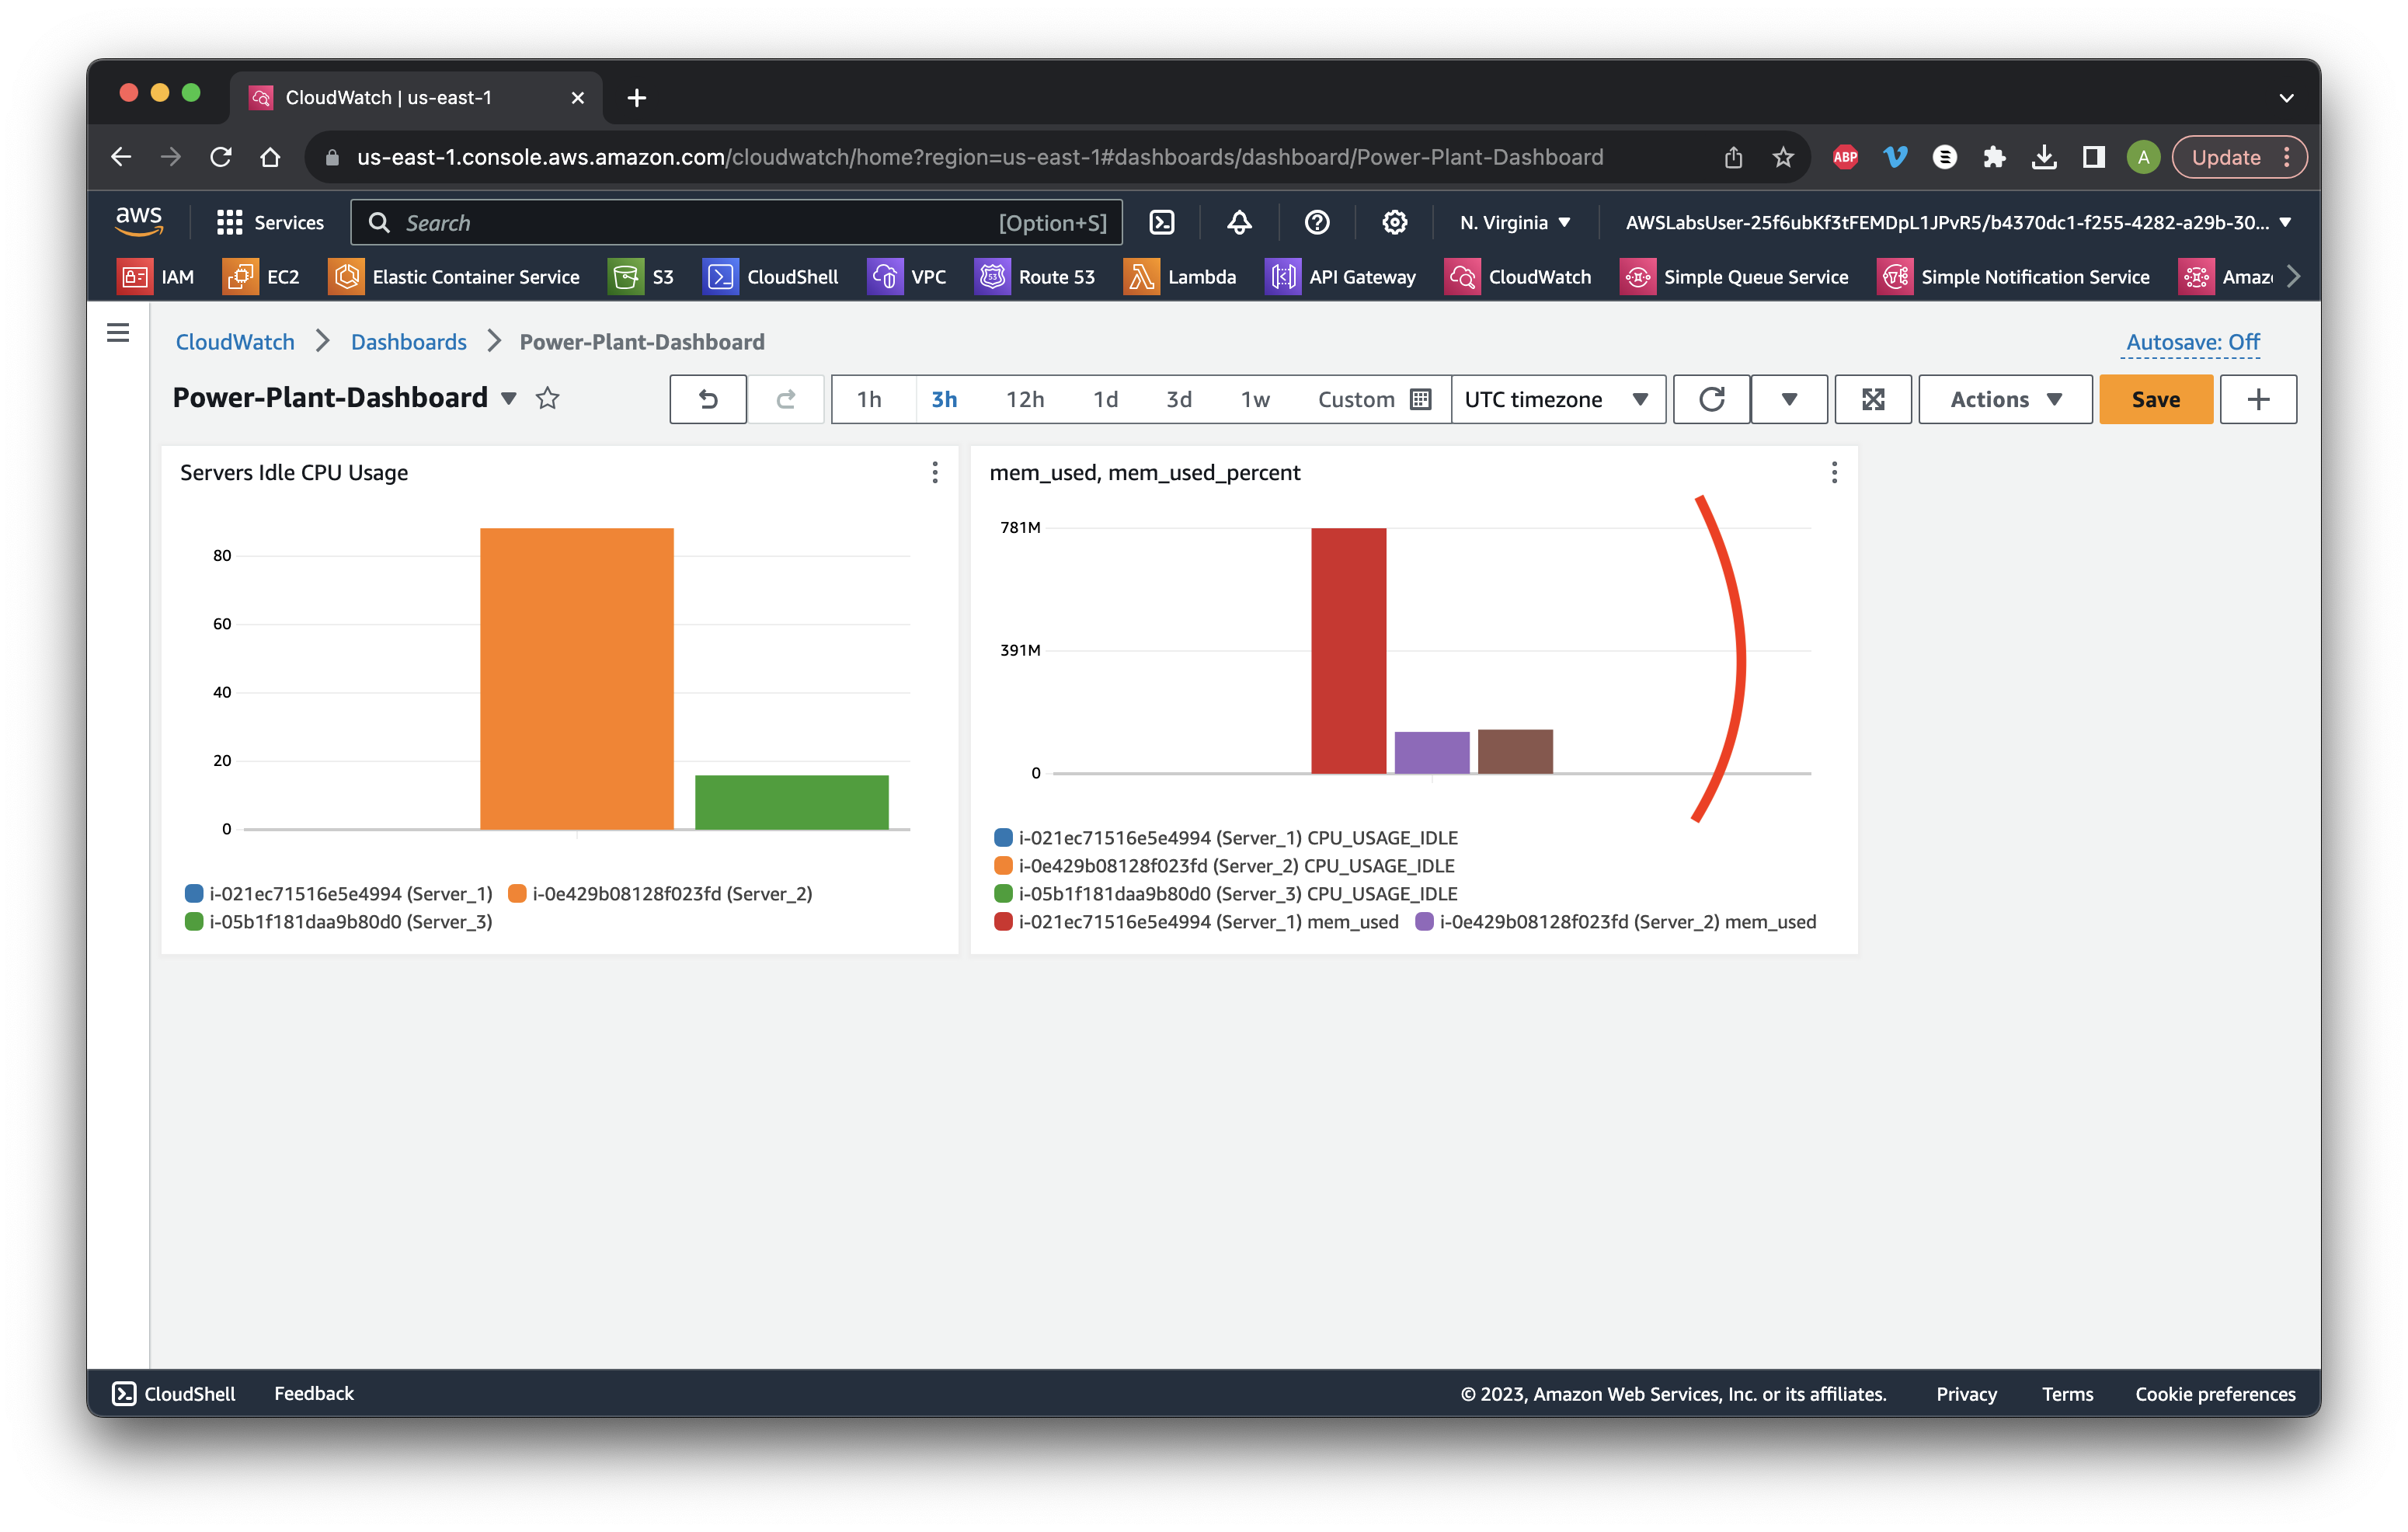
Choose Bar for Widget type. Give it the title Servers Idle CPU Usage. Click Add to dashboard.
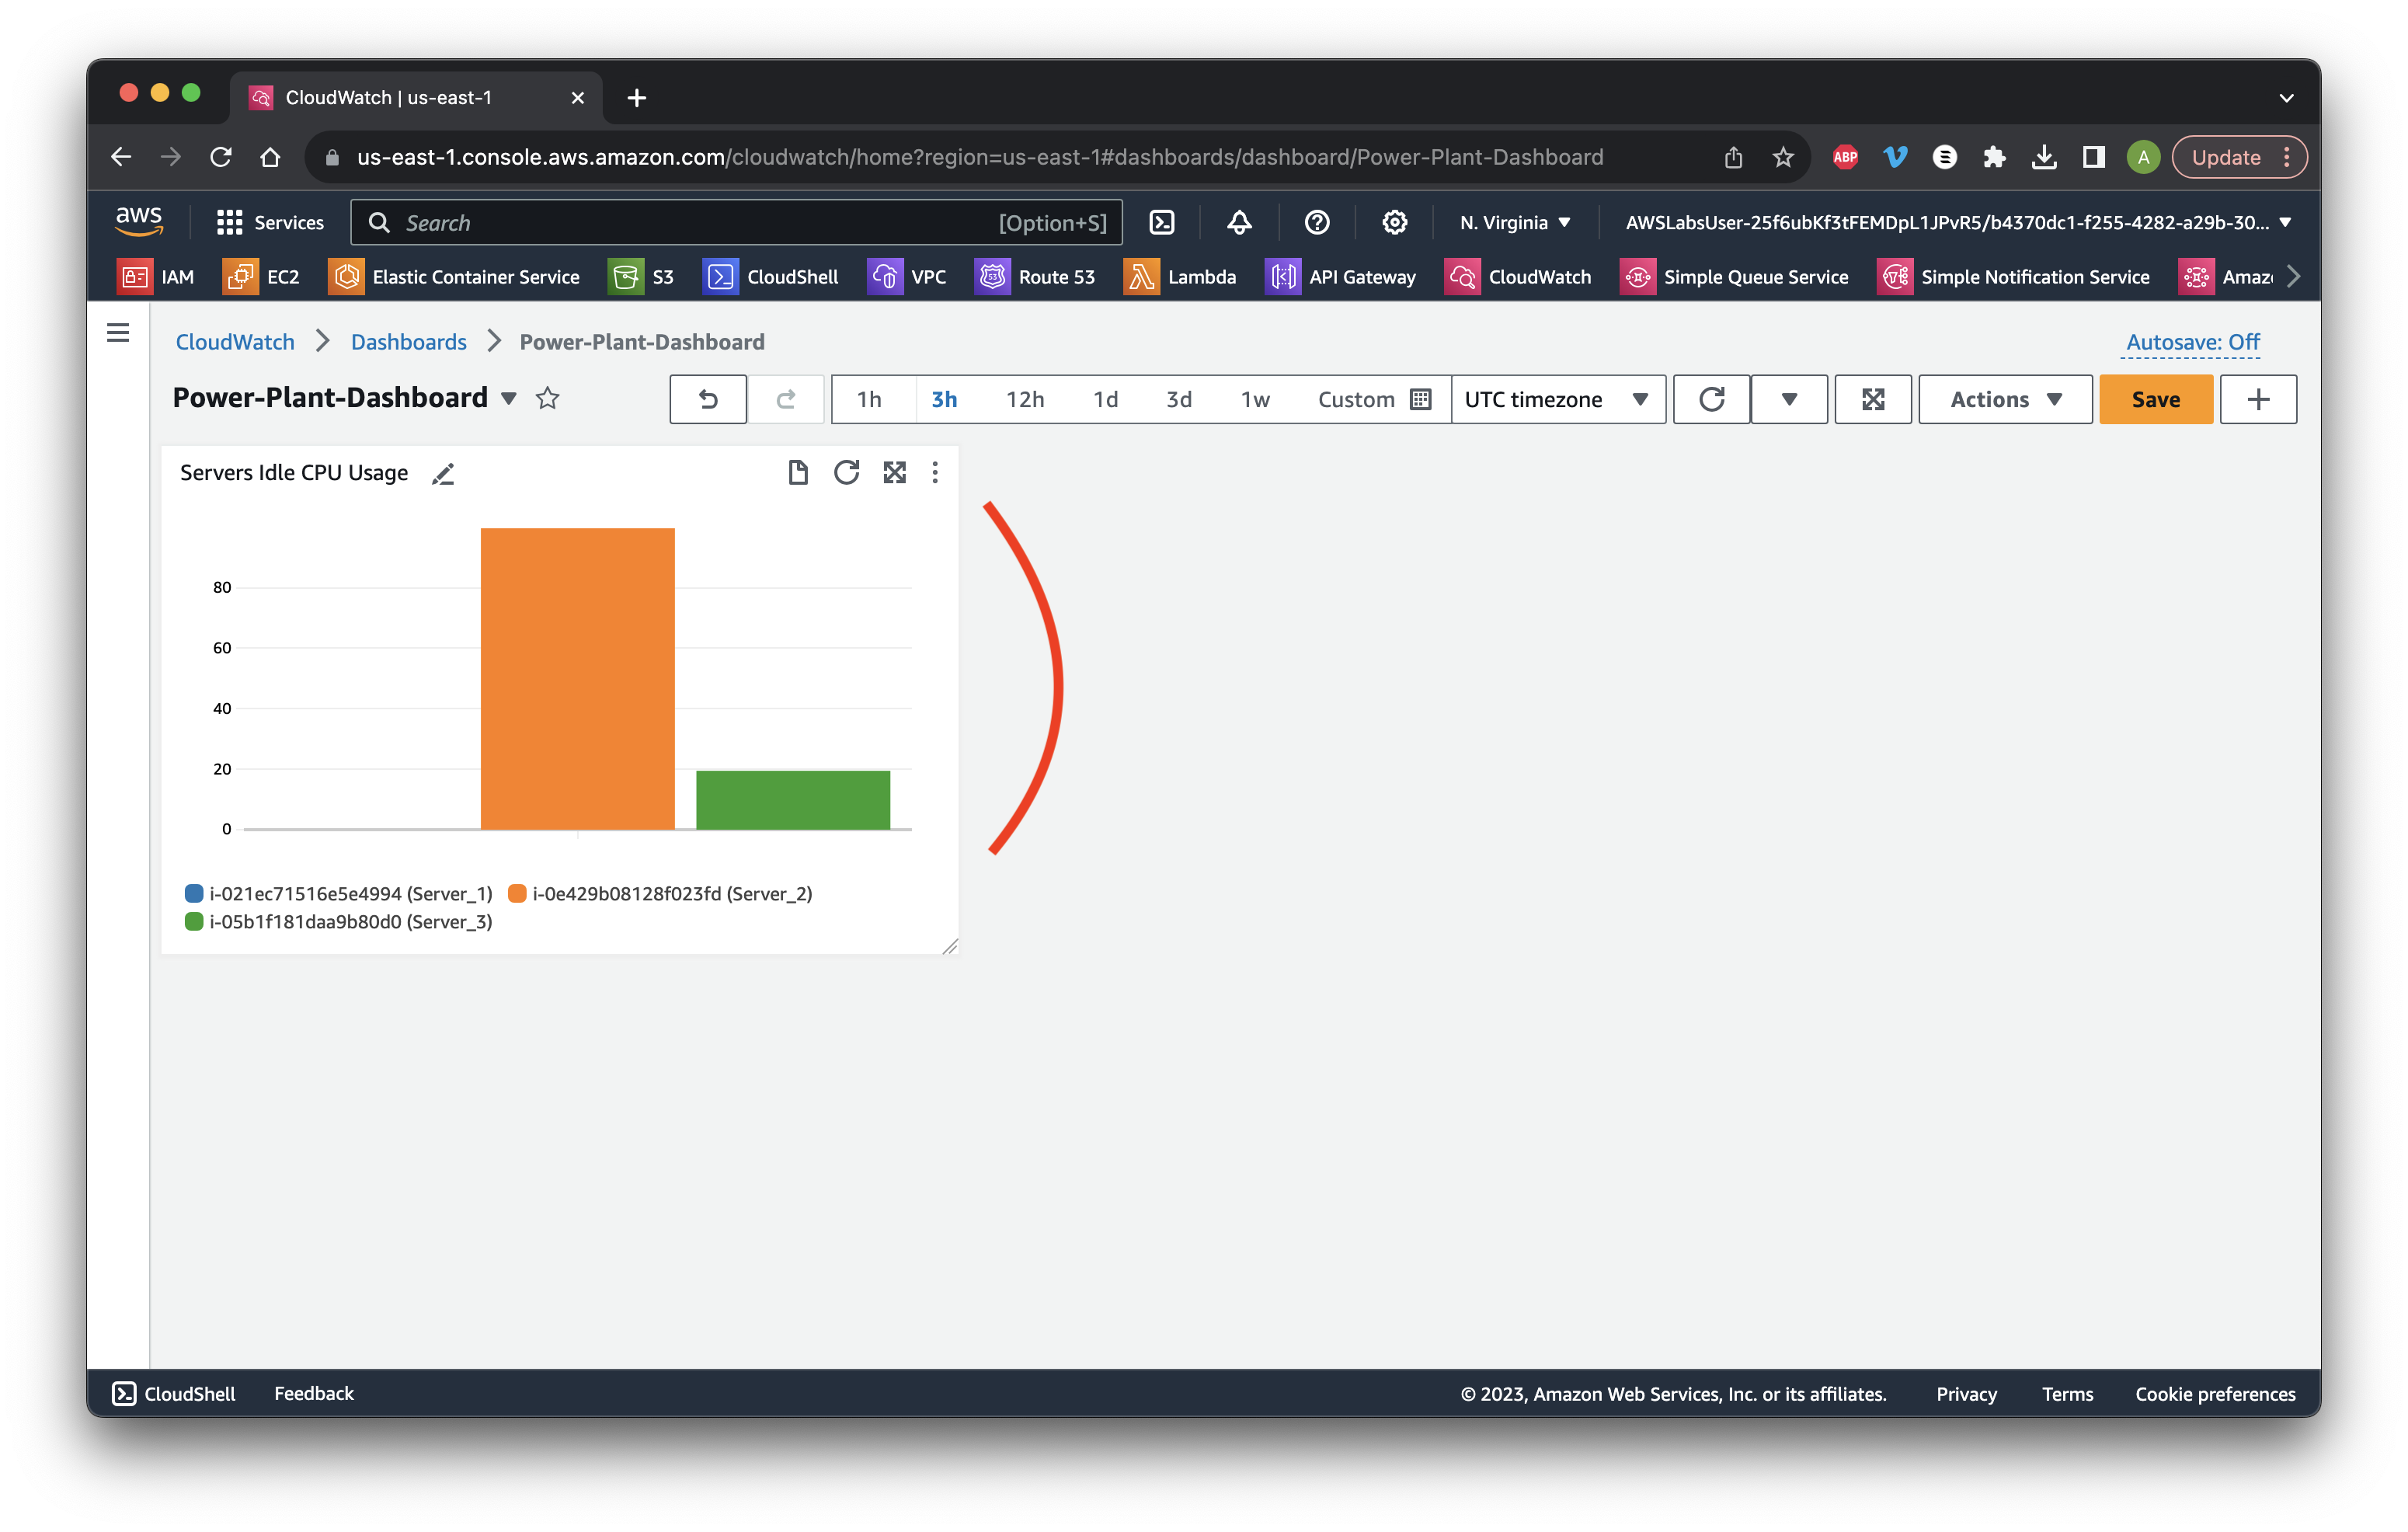
Review the graph then click Save.
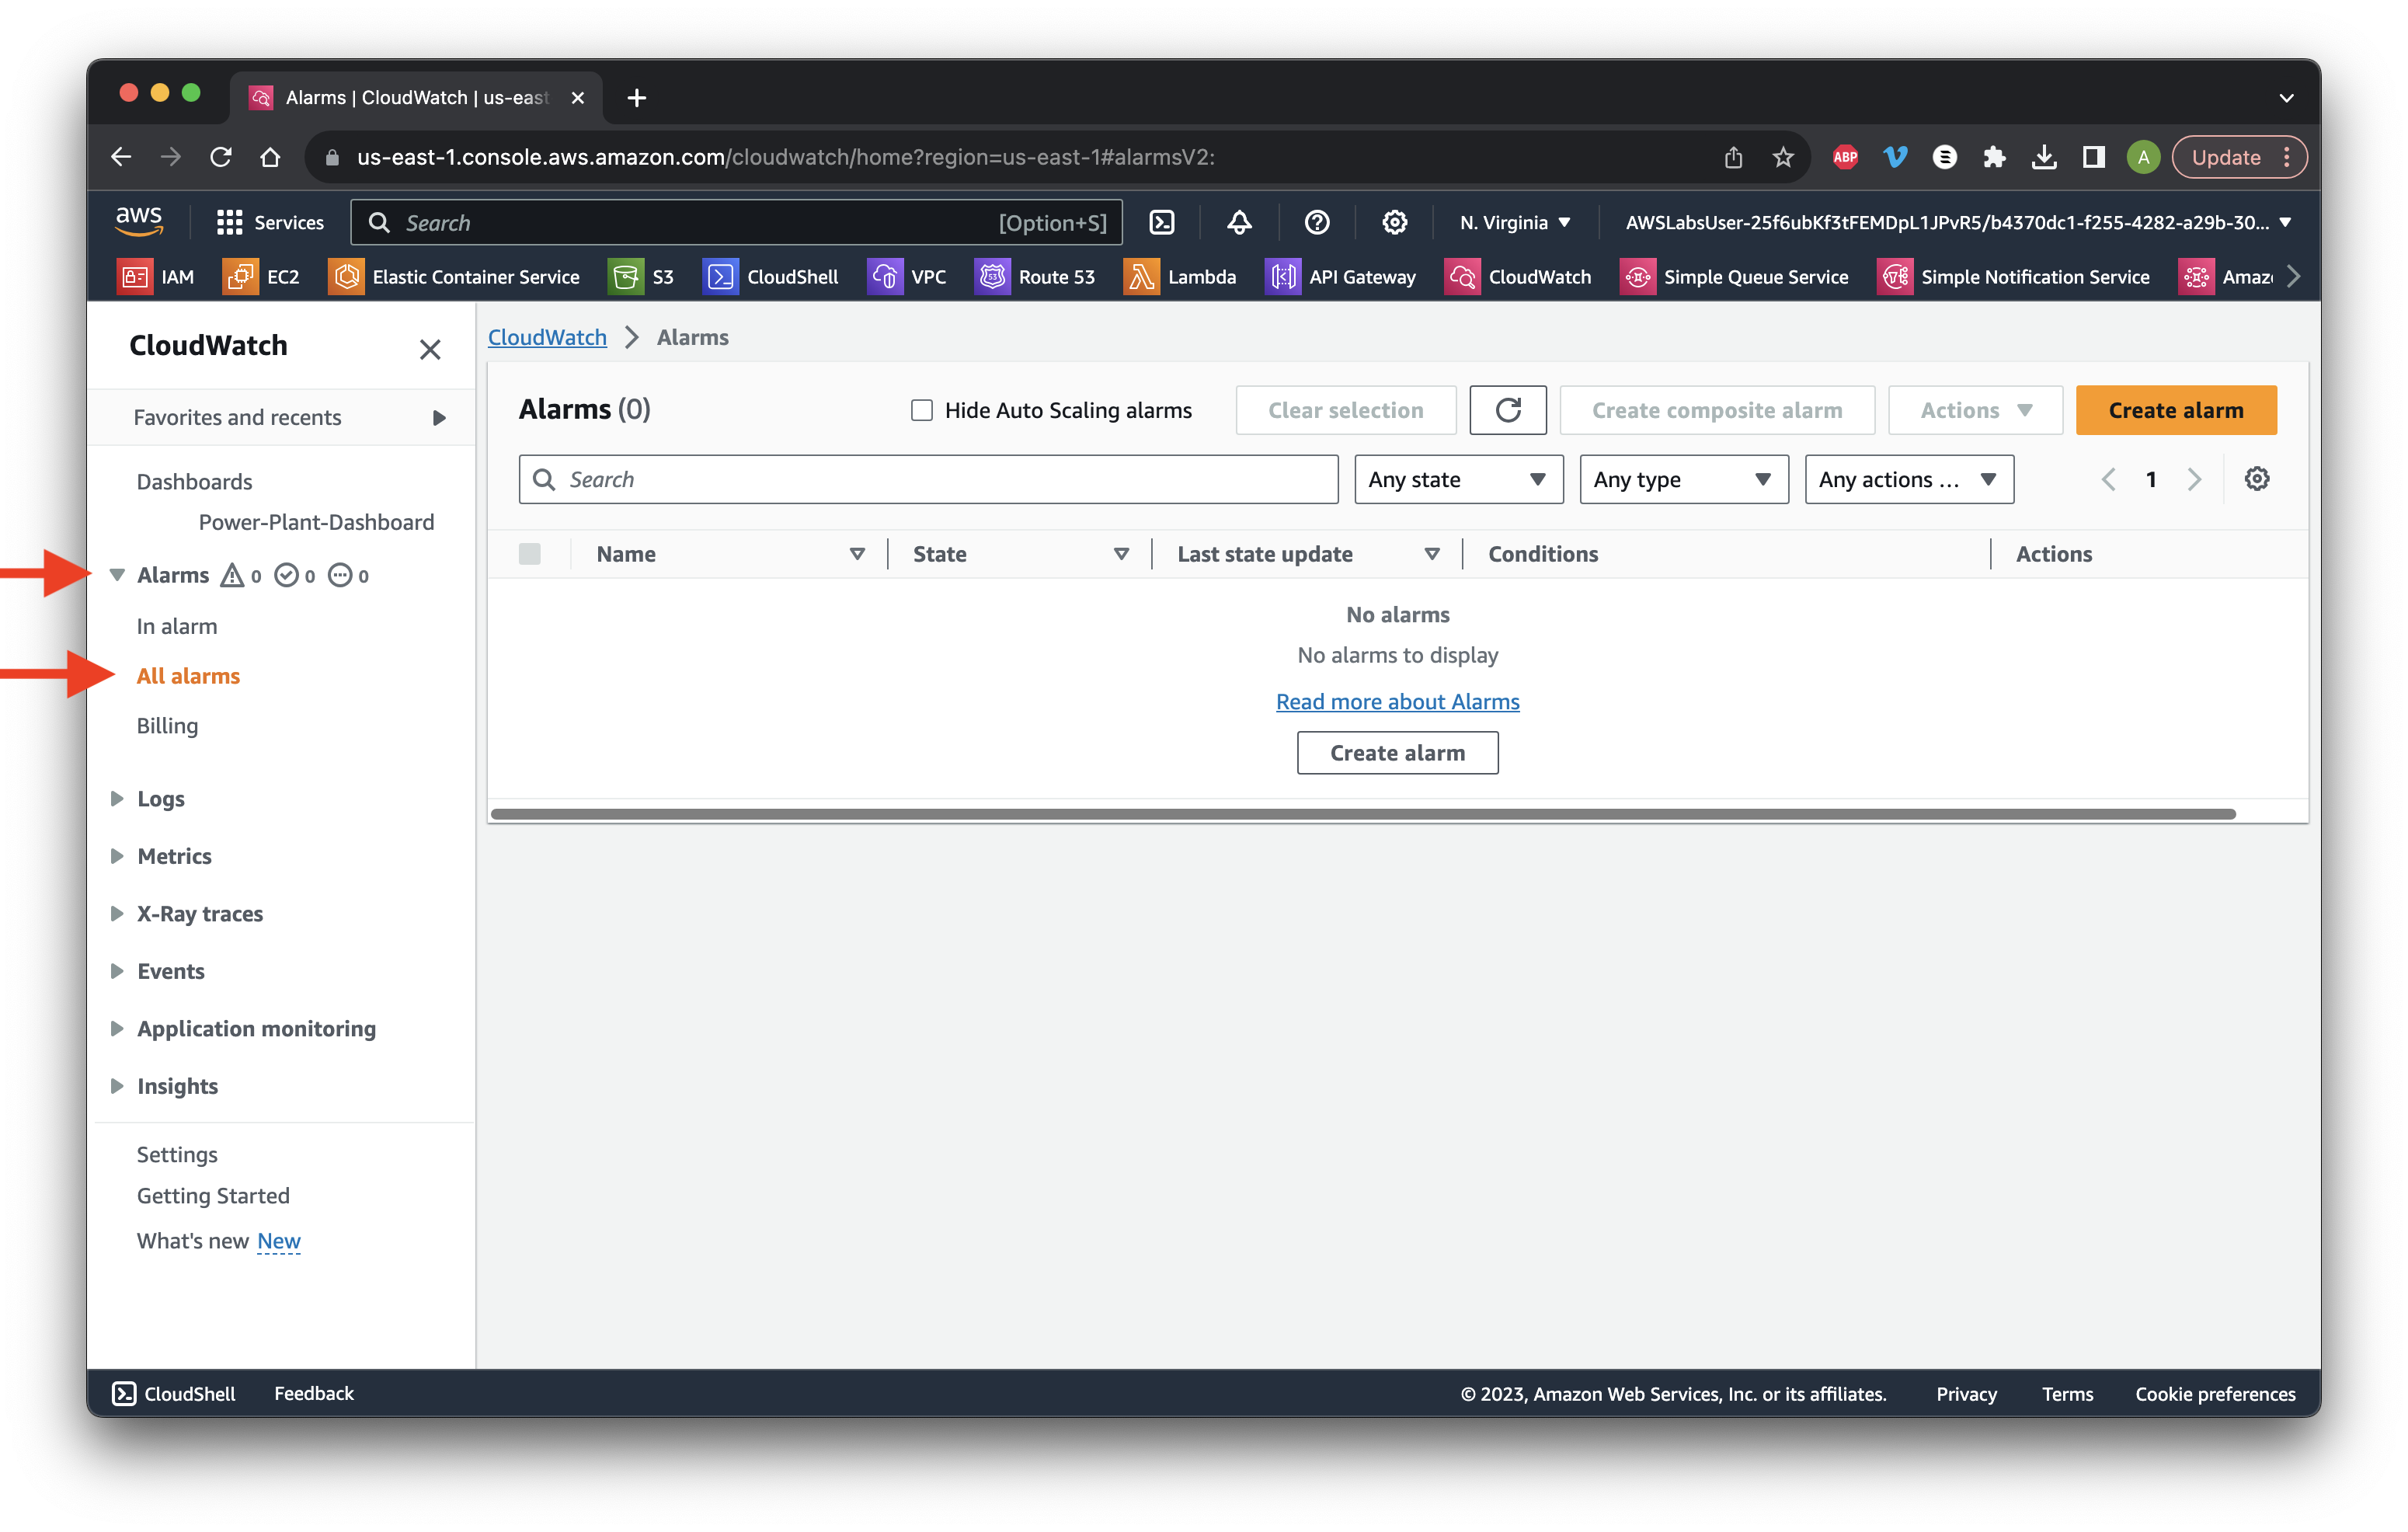
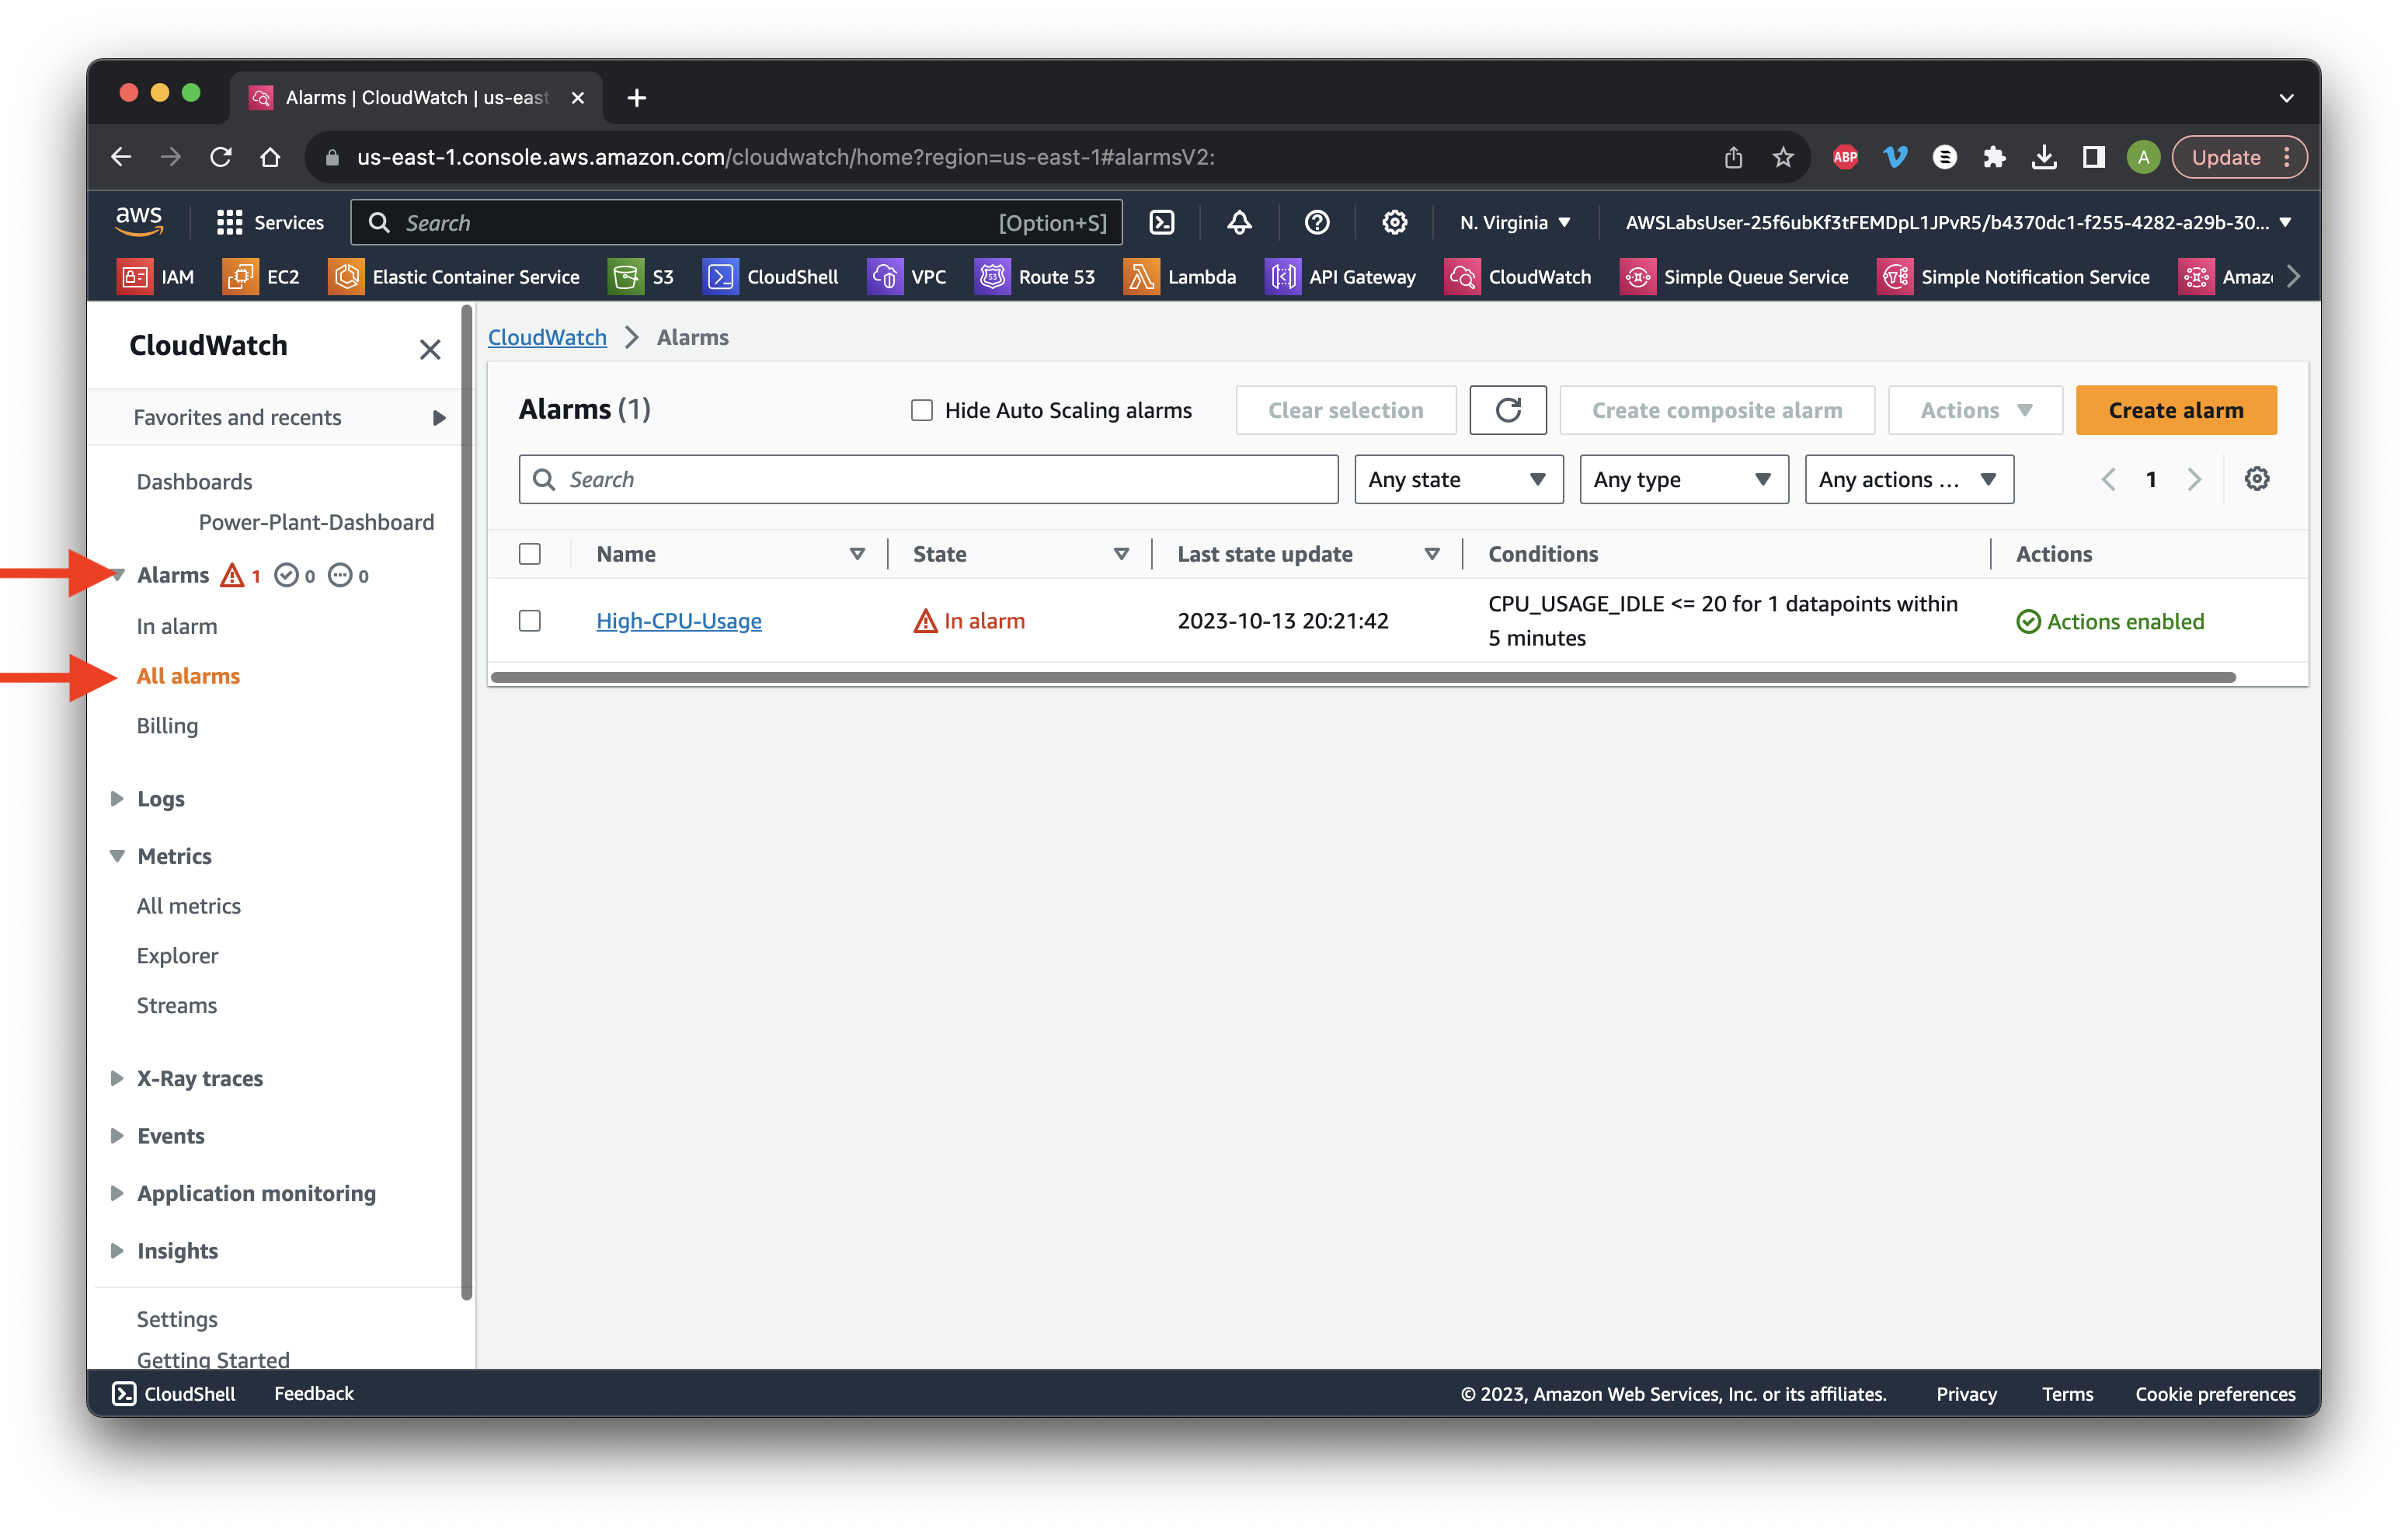
Go to the Alarms dropdown and select All Alarms. Click Create alarm.
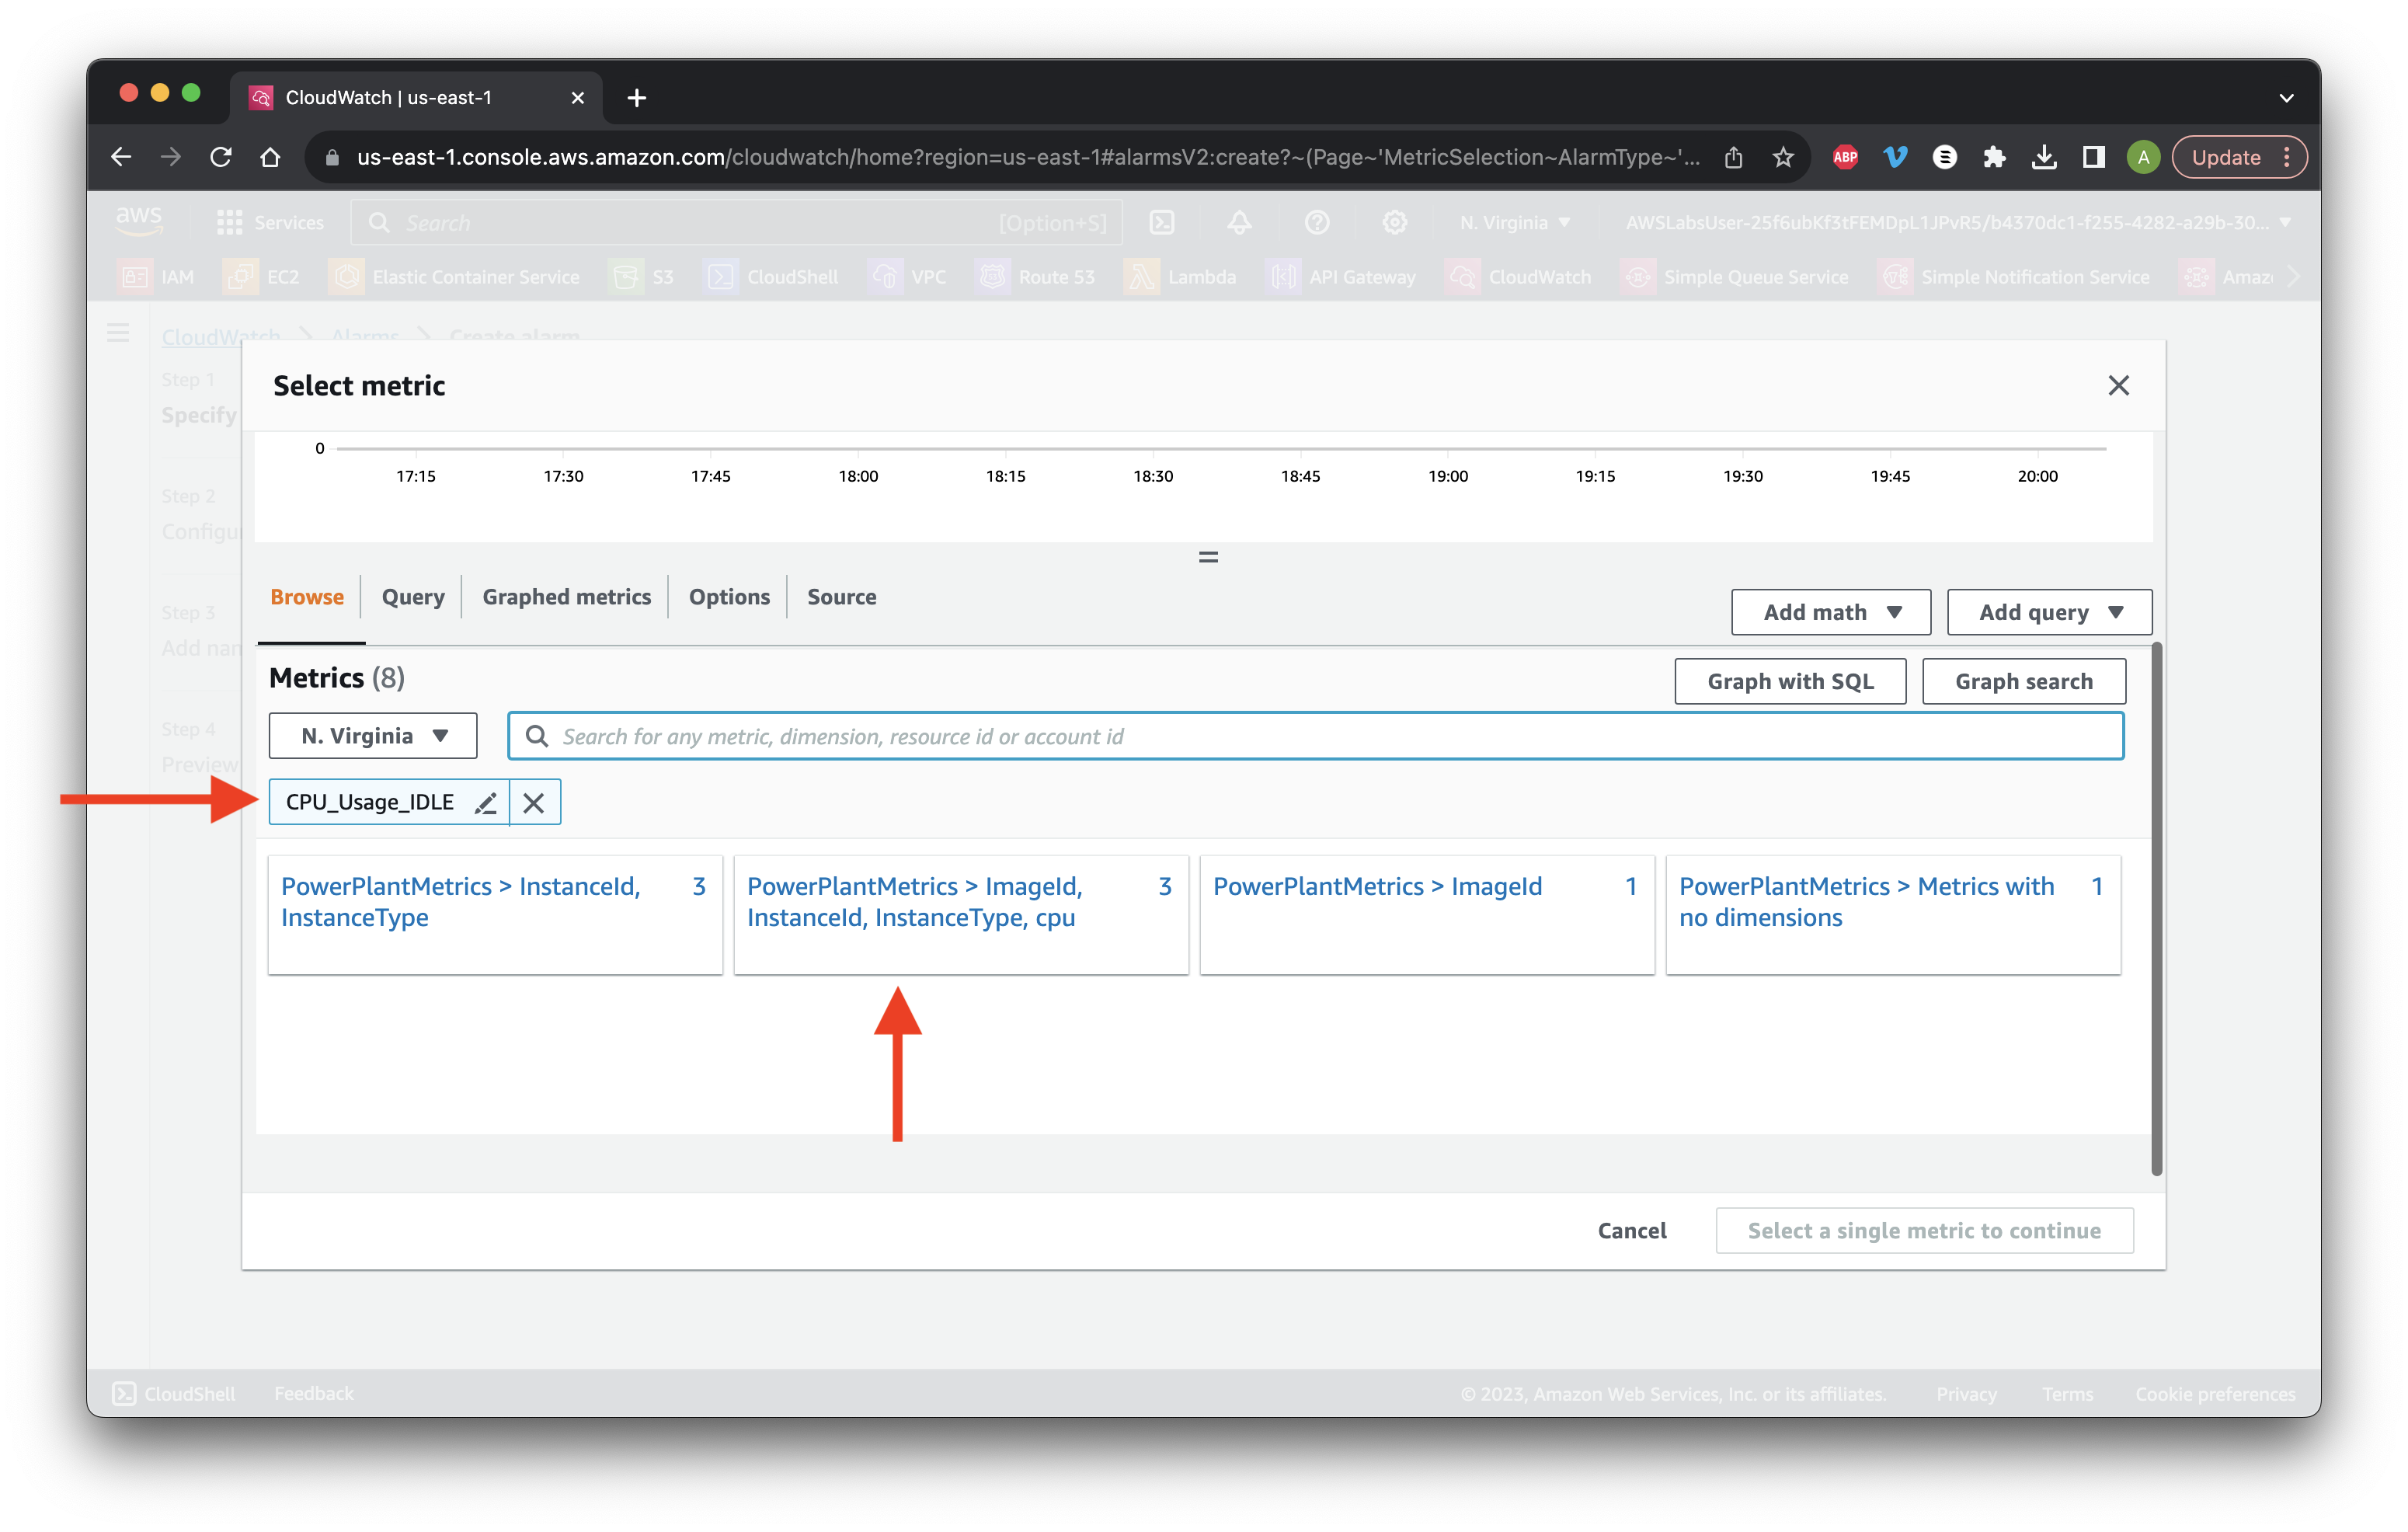
Click Select metric then search for CPU_Usage_IDLE. Click the ImageId, InstanceId, etc. metric.
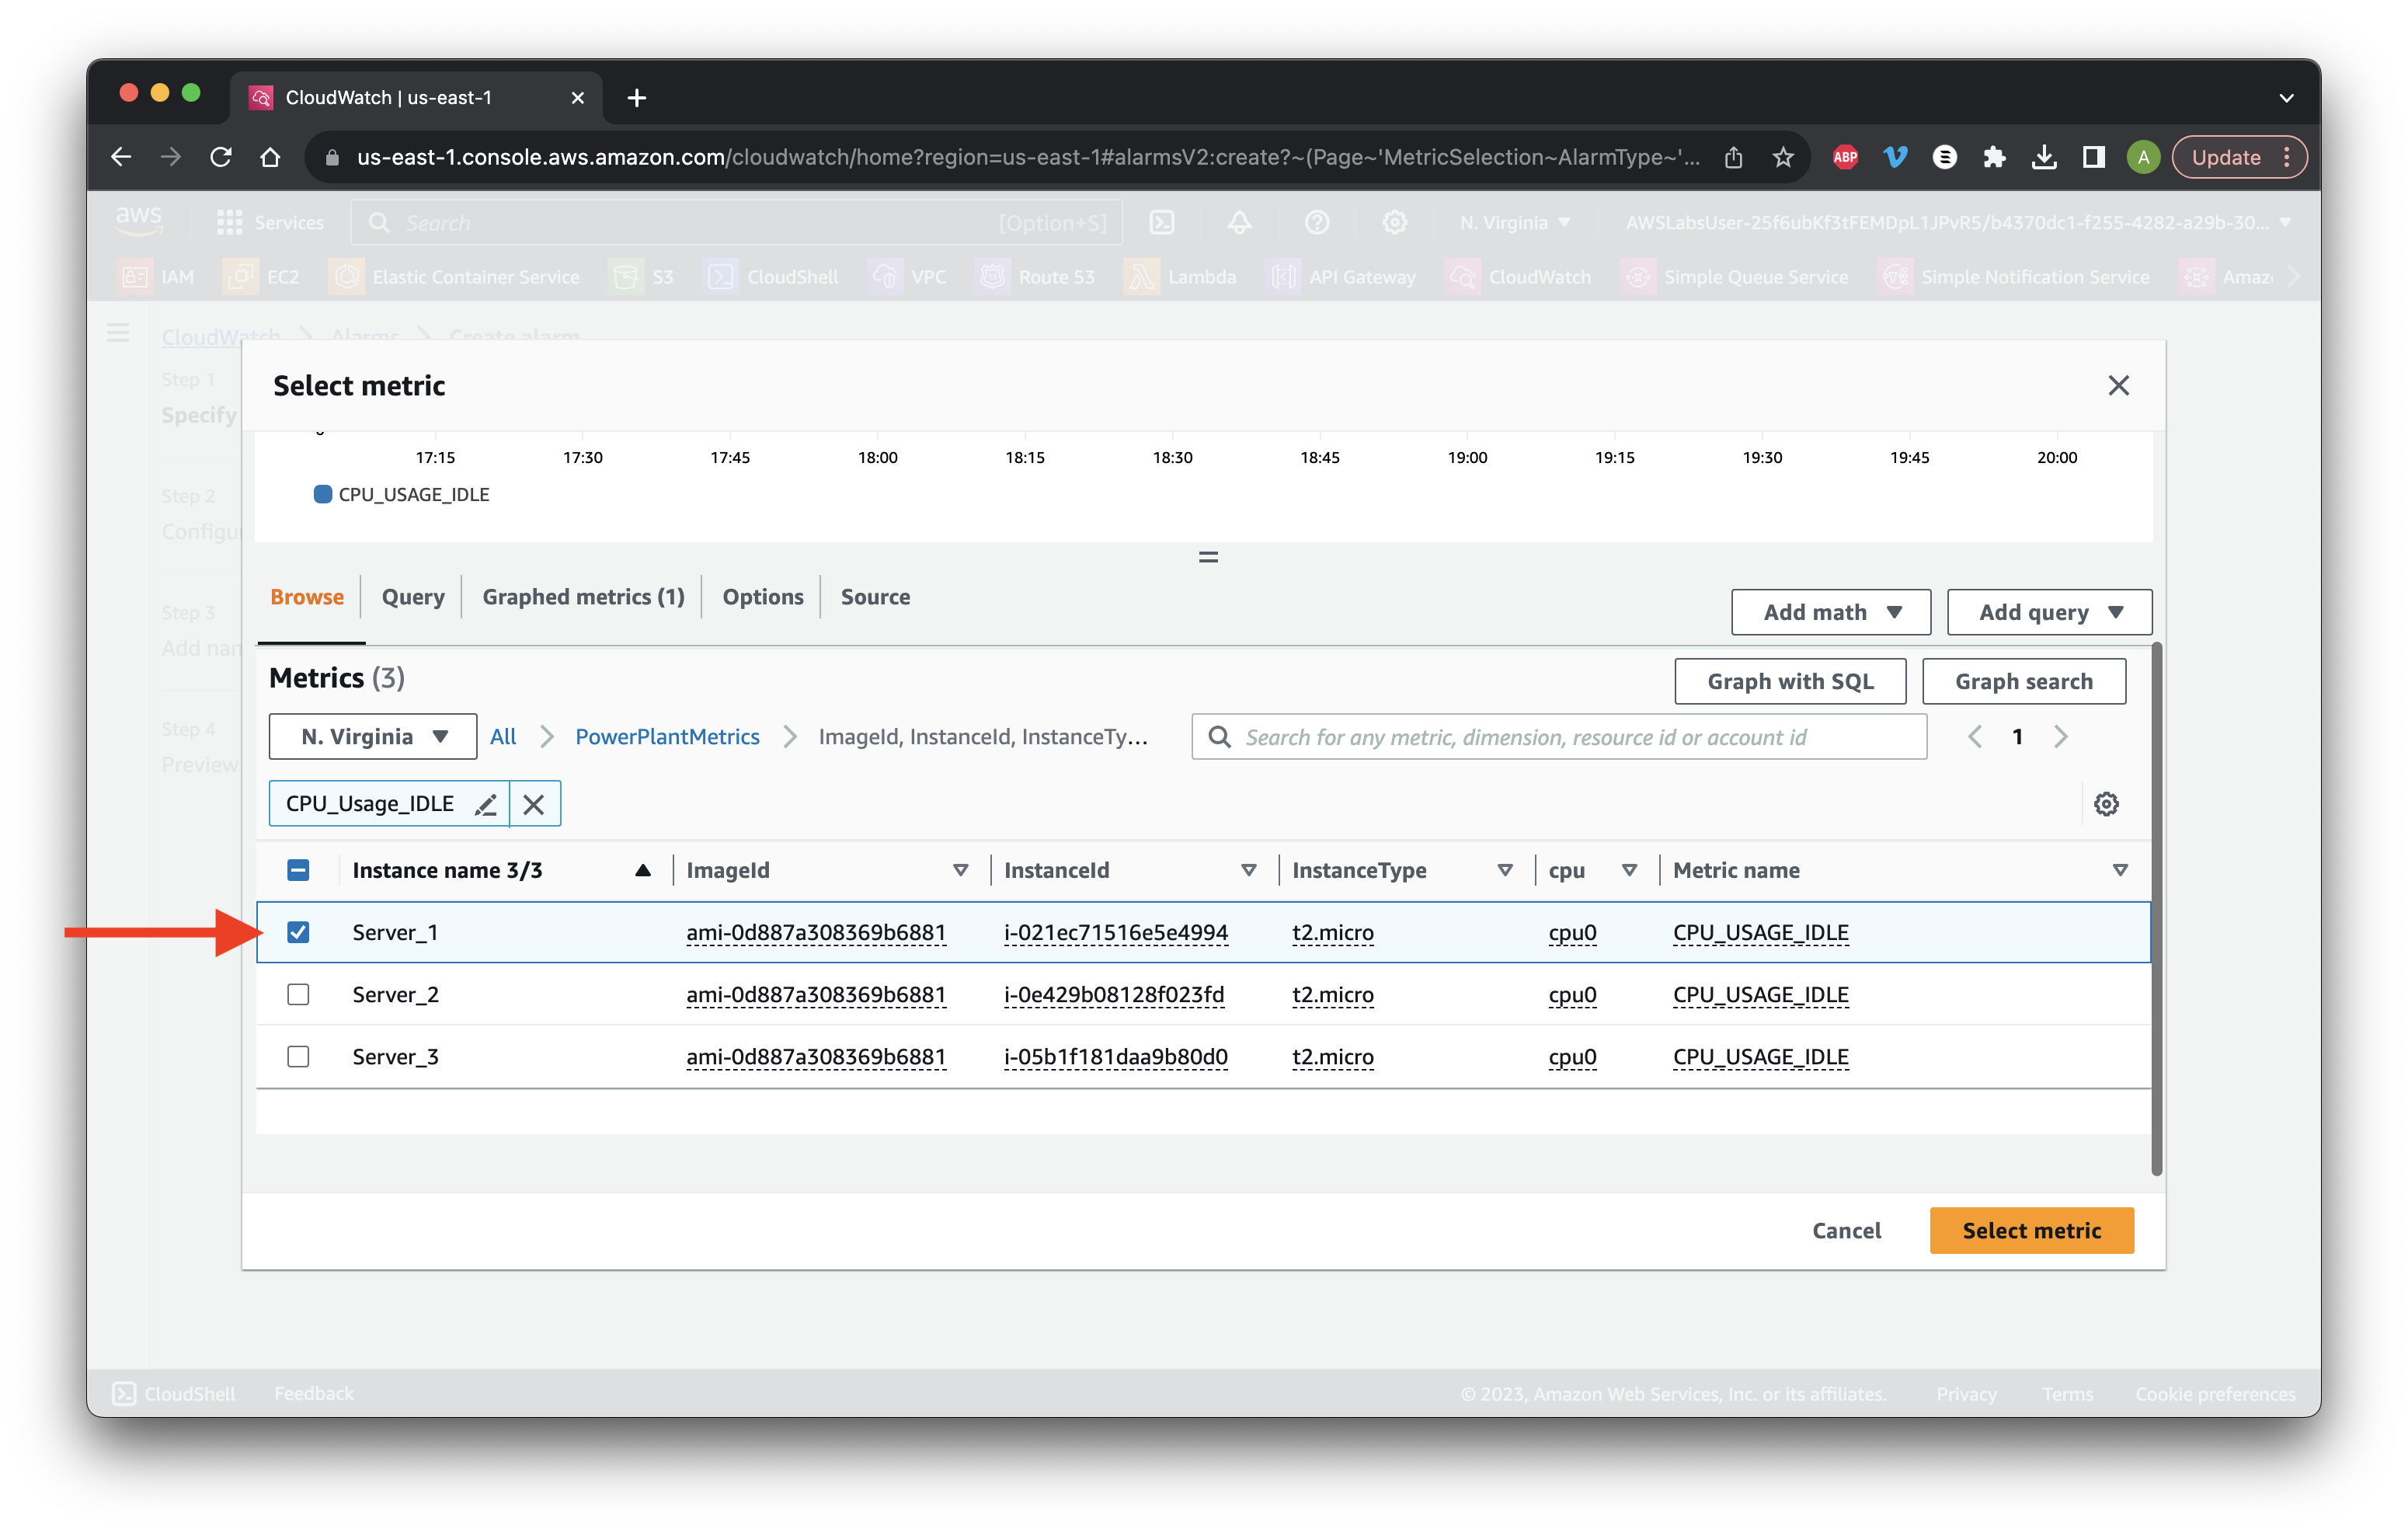
Choose Server_1 and click Select metric.
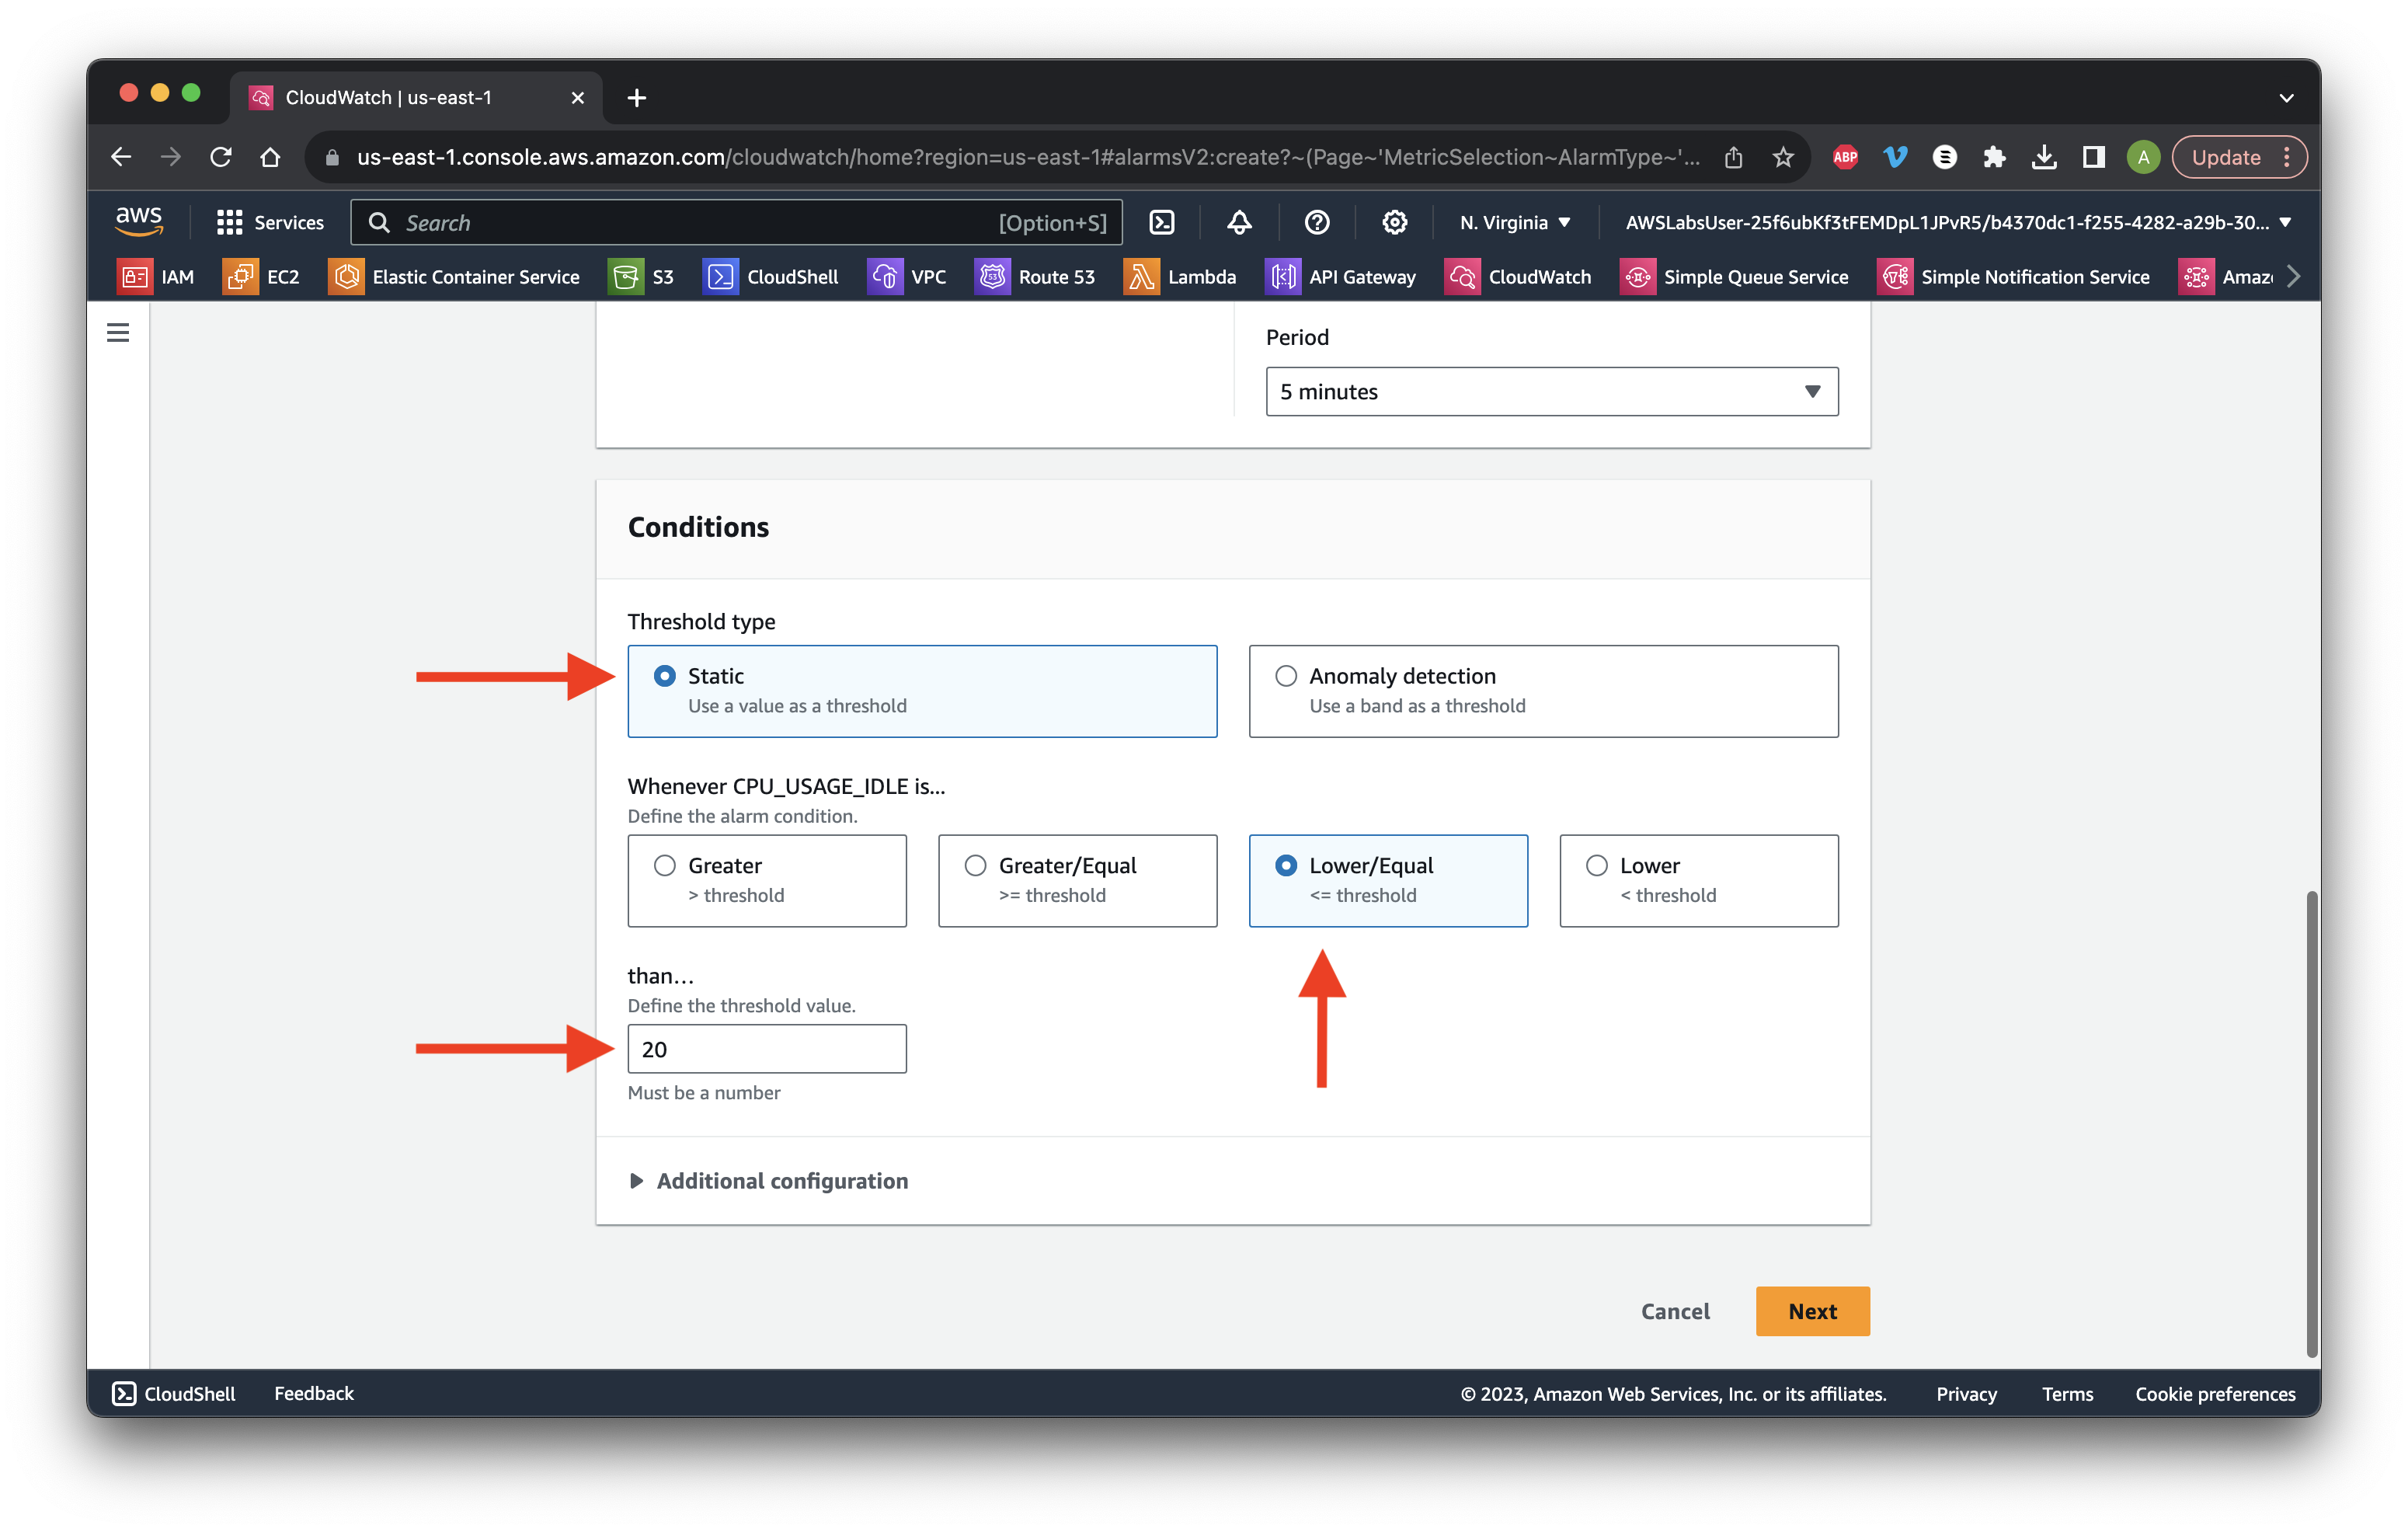
Scroll down and choose a Static Lower/Equal threshold. Define the value as 20 percent of CPU idle usage and click Next.
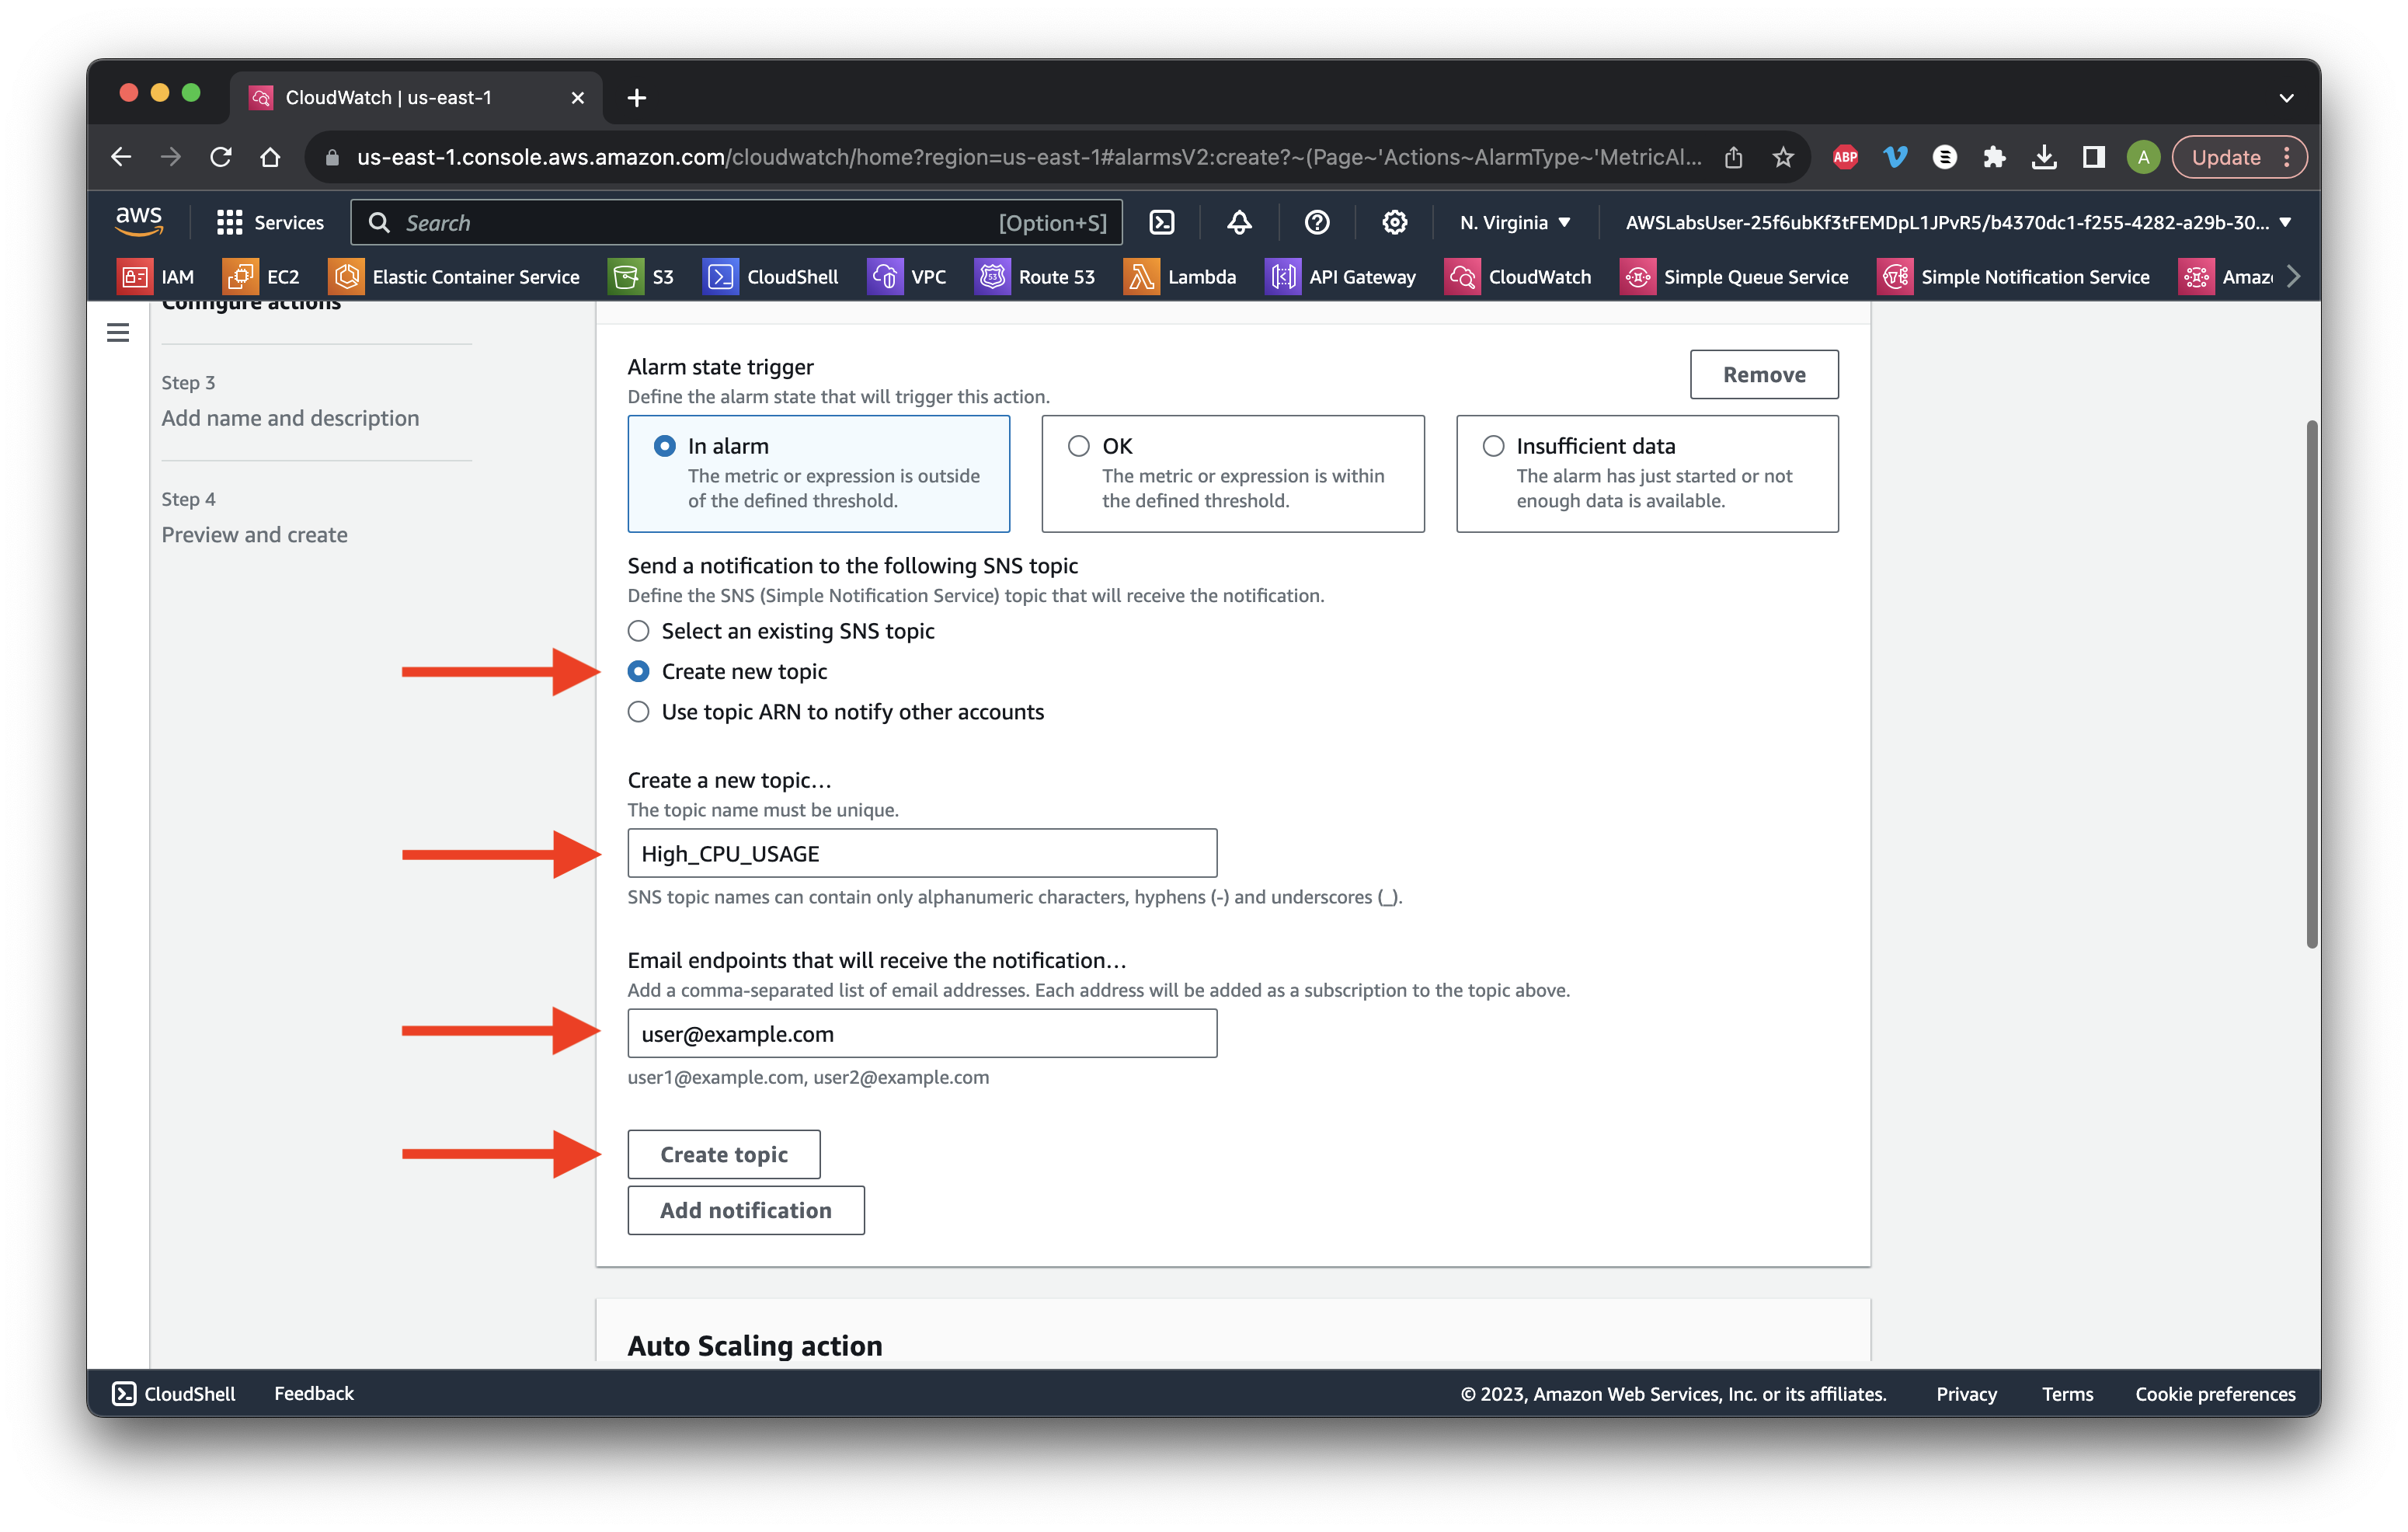
Create a new topic and type High_CPU_USAGE. Enter your email to subscribe to the SNS topic. Click Create topic. Scroll down and click Next.
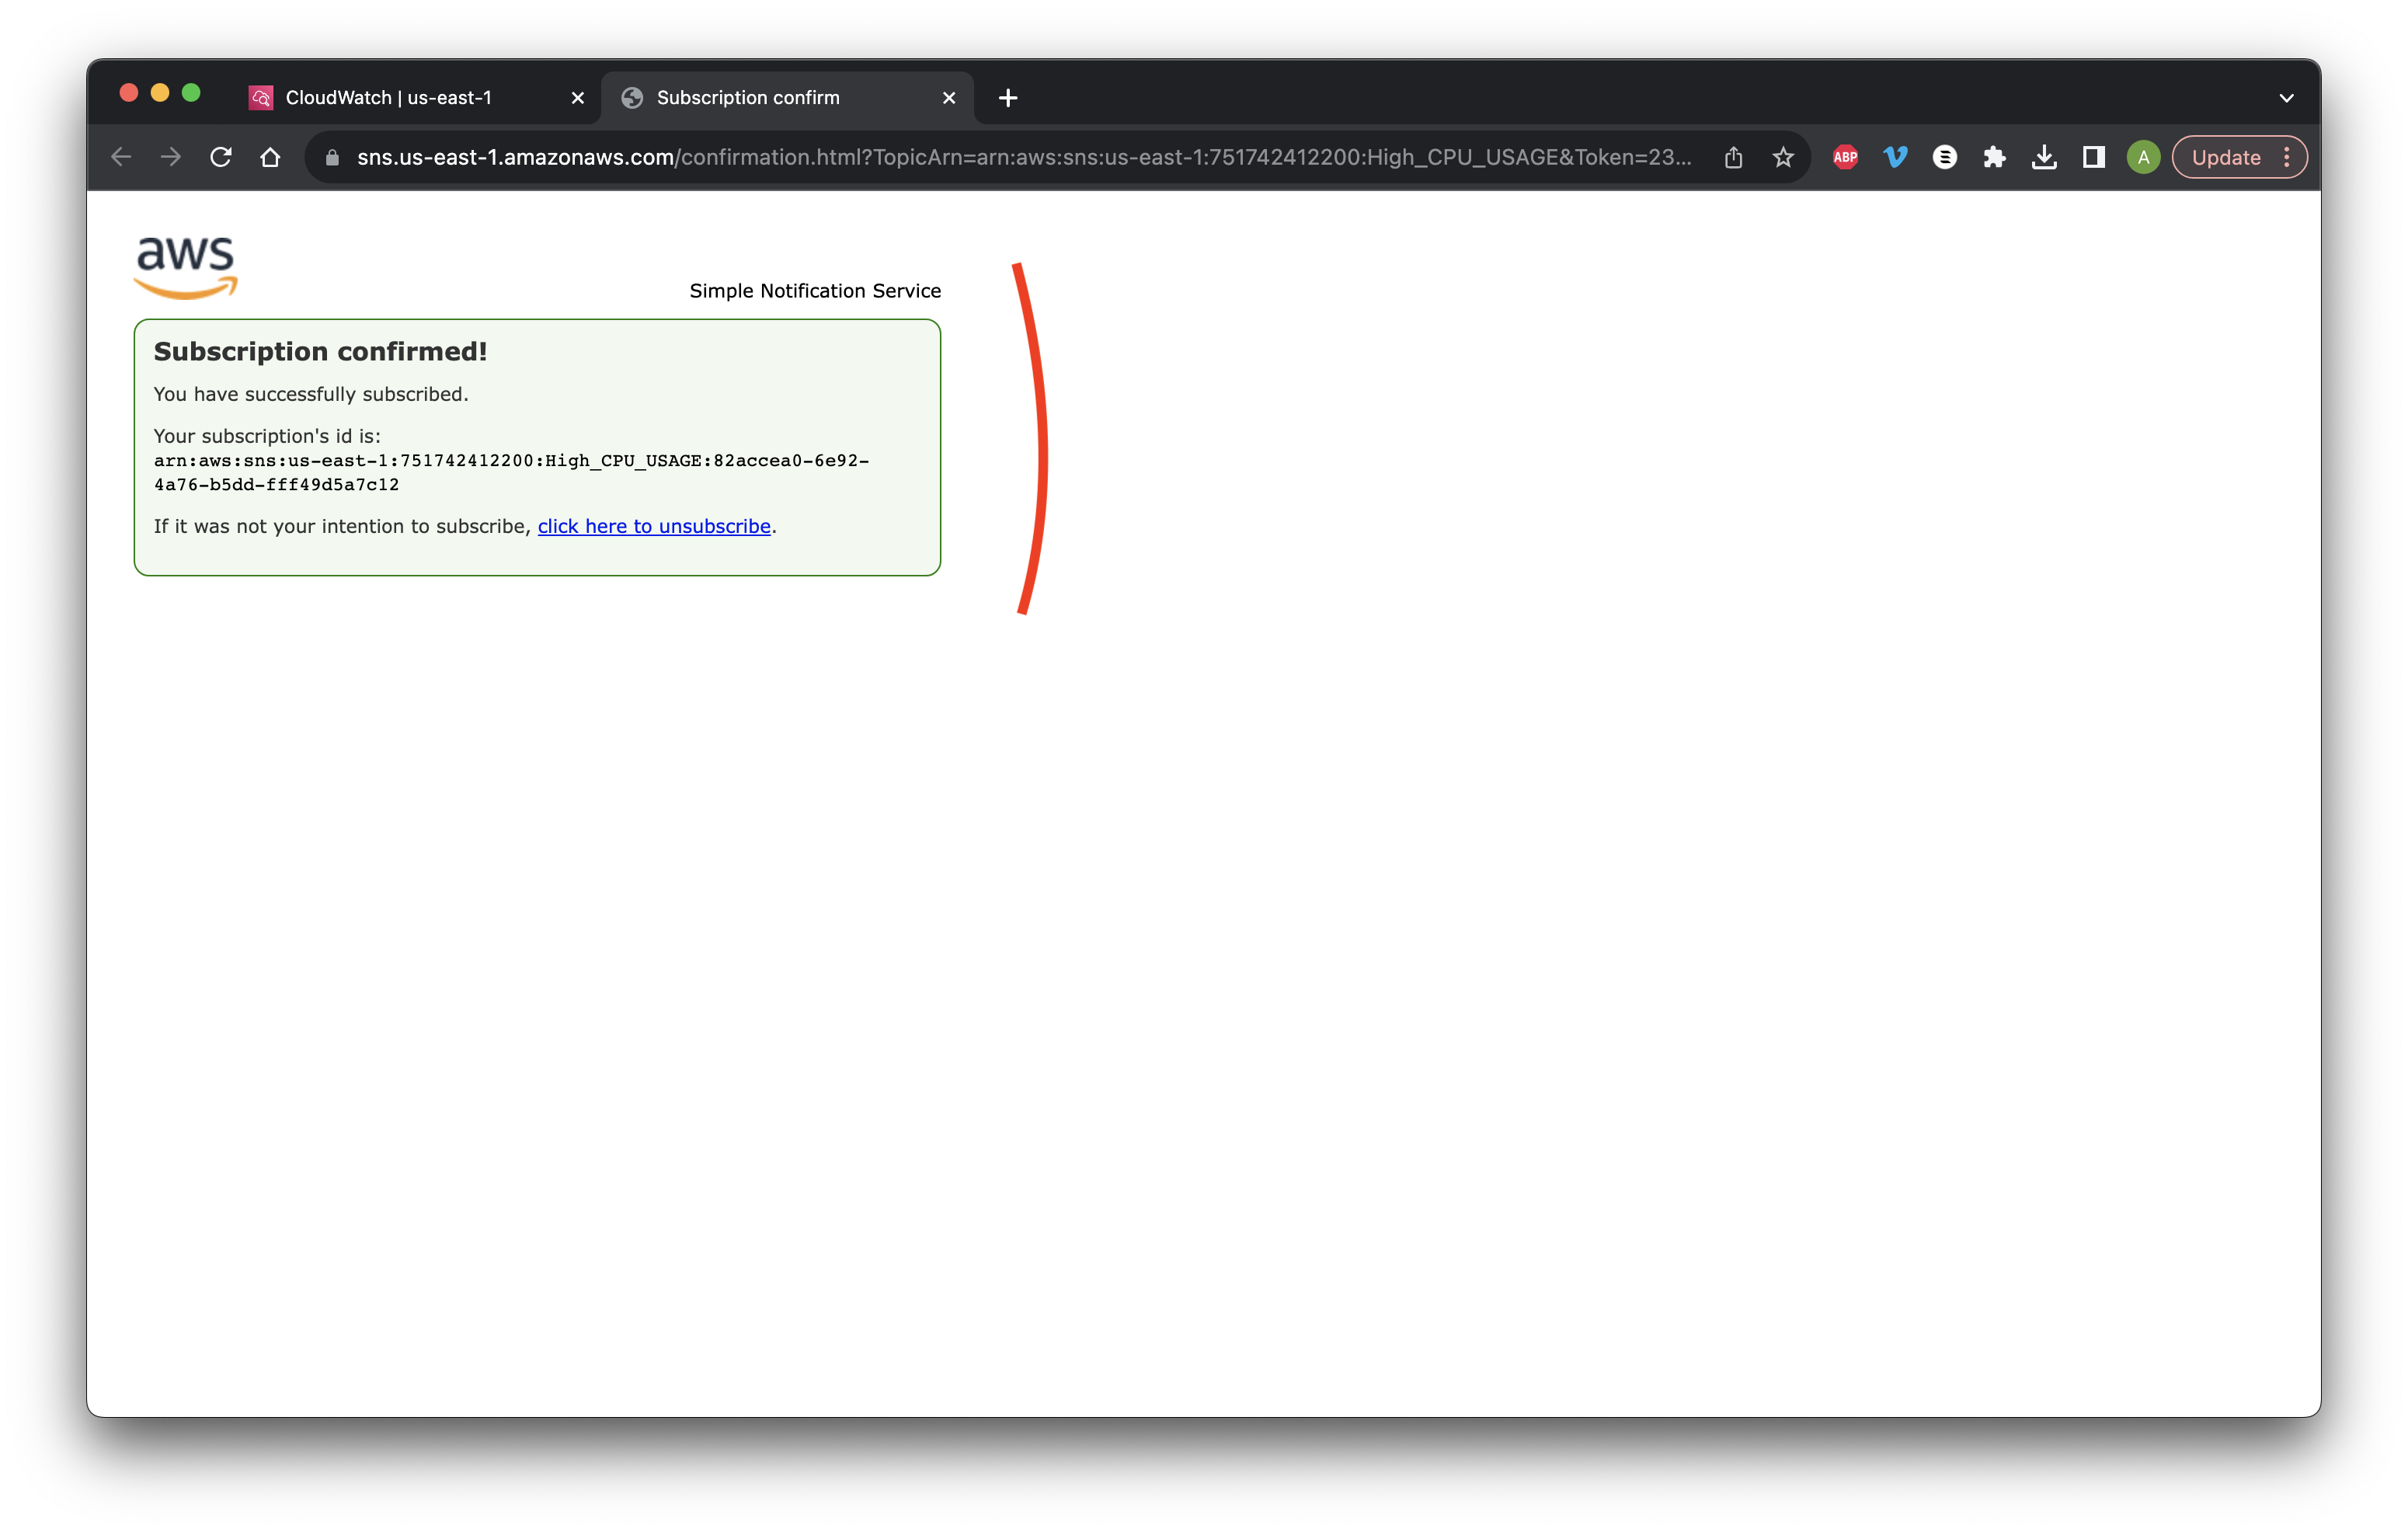
Check your email and click the subscription confirmation link.
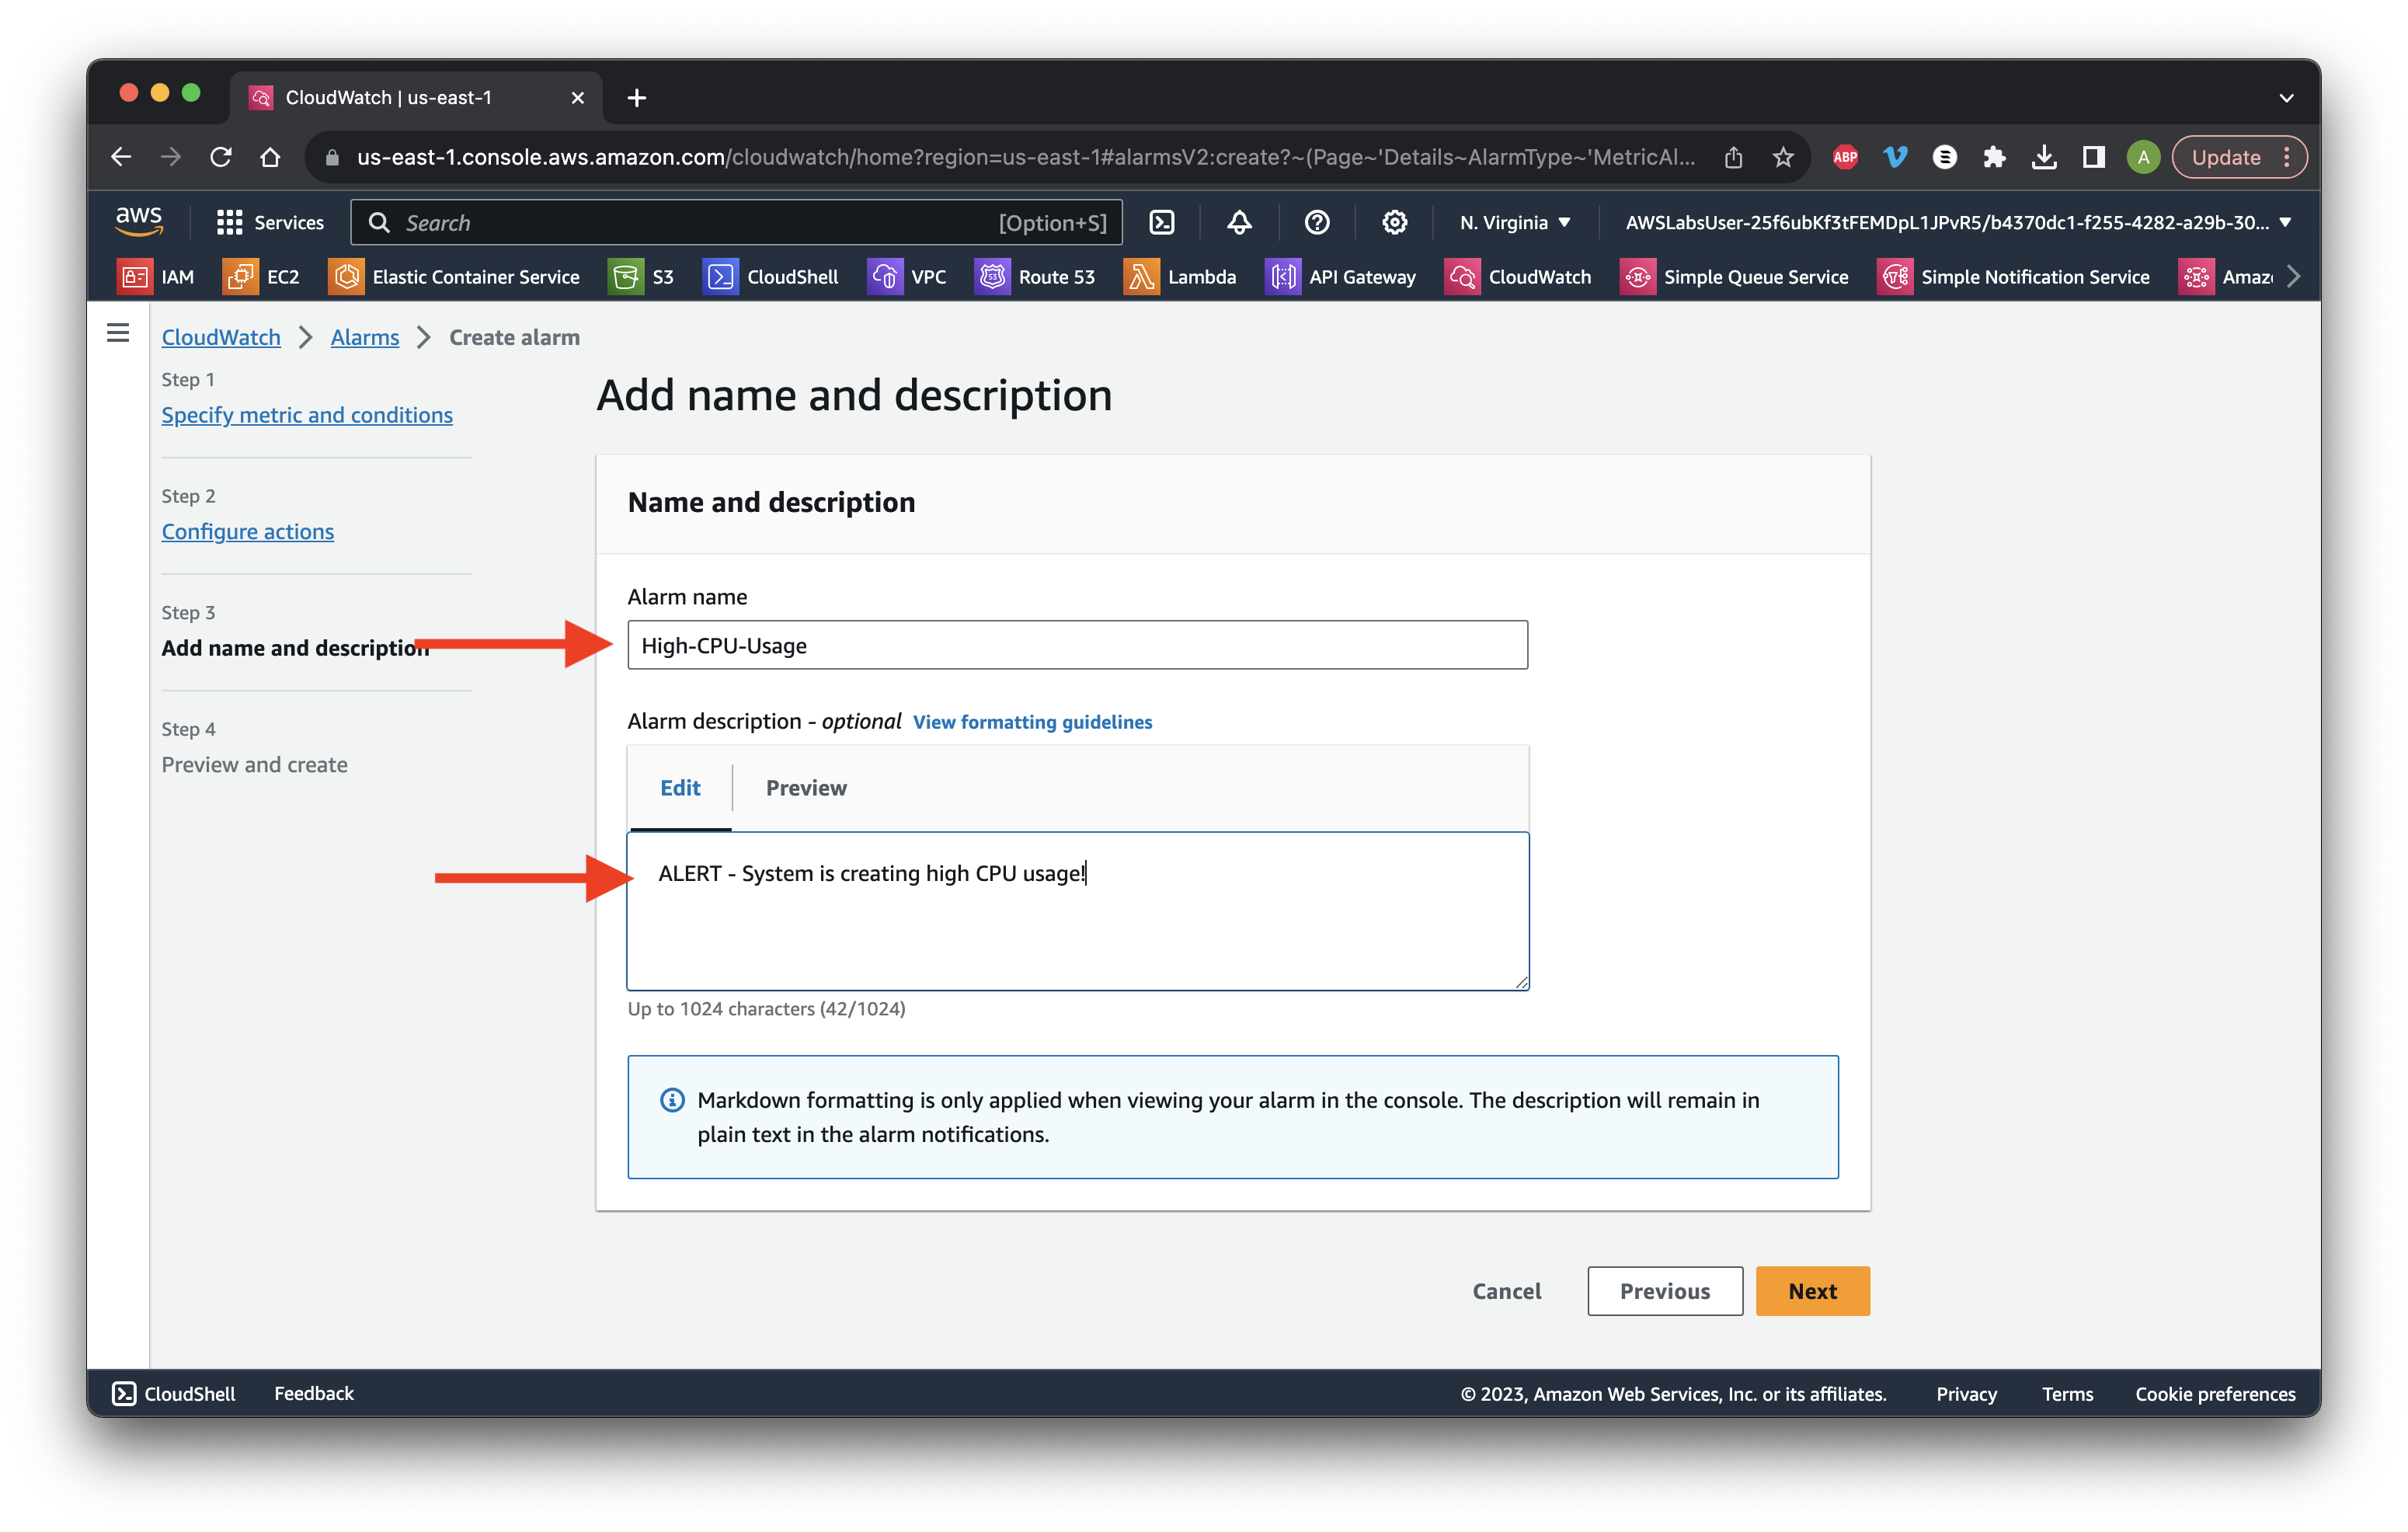
Name the Alarm High-CPU-Usage and type a description. Click next. Scroll down and click Create alarm.
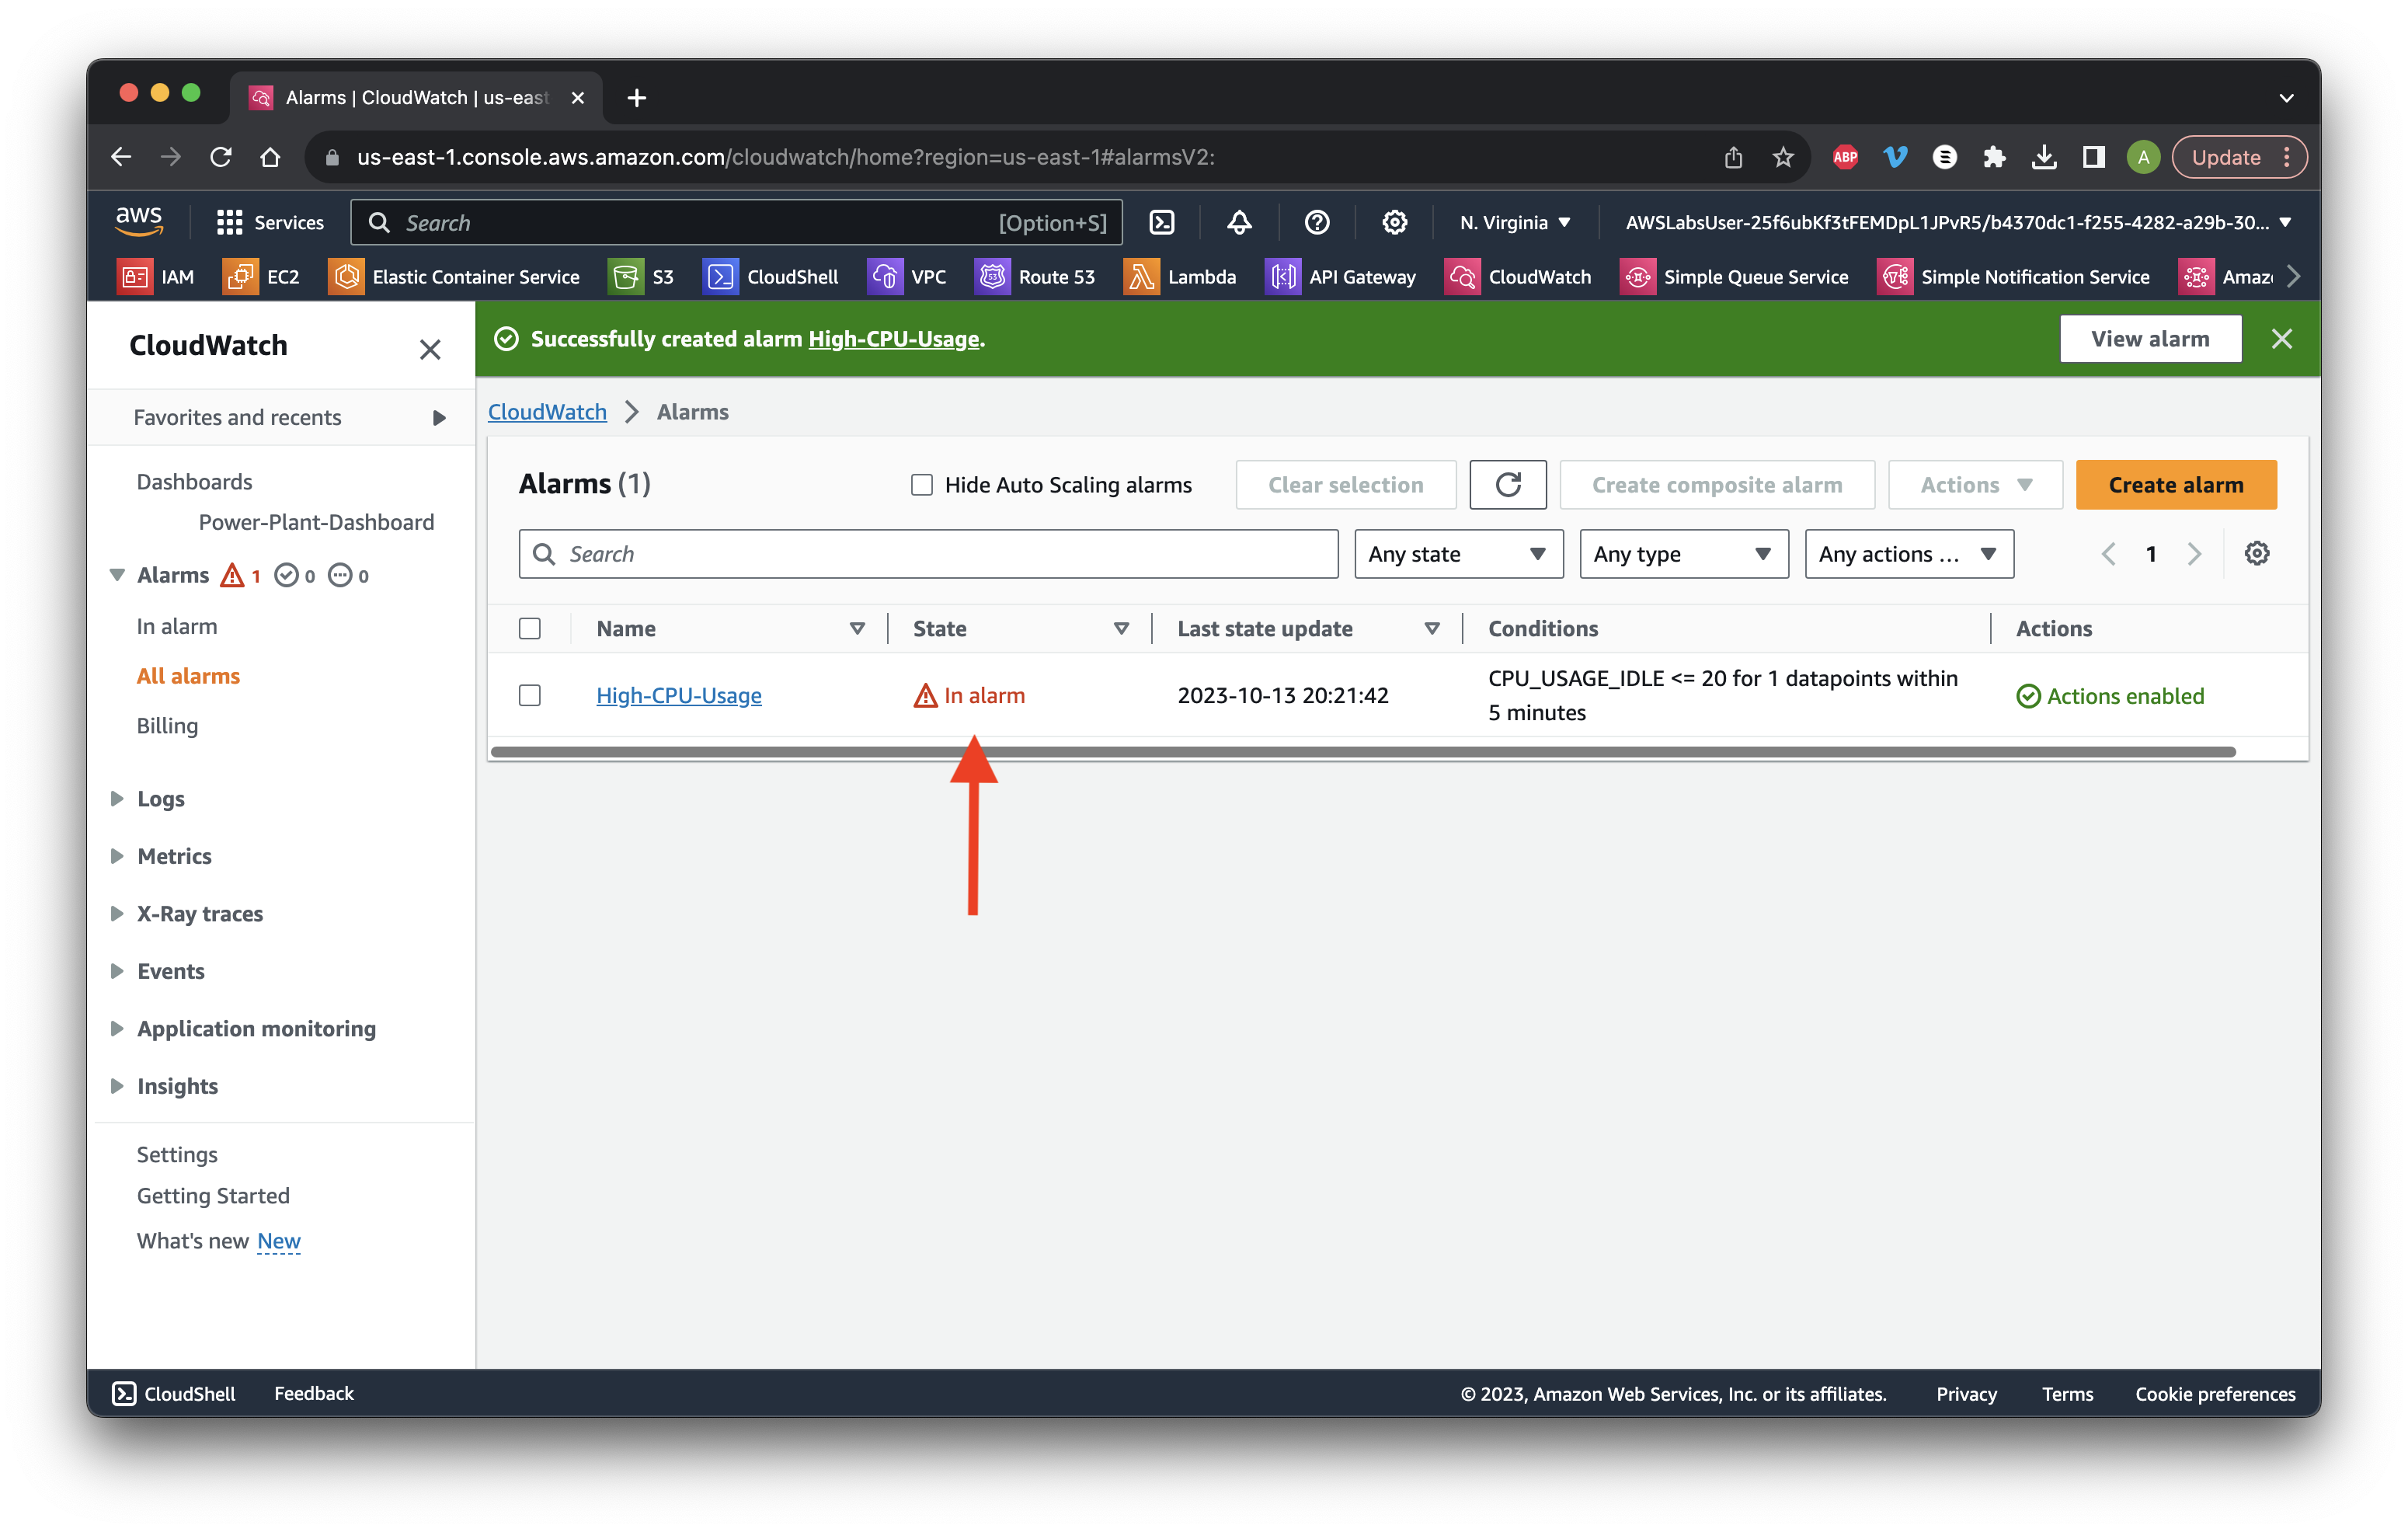
Review the State and check your email to confirm the SNS notification.
Return to the Metrics dropdown and select All metrics. Select InstanceId, InstanceType.
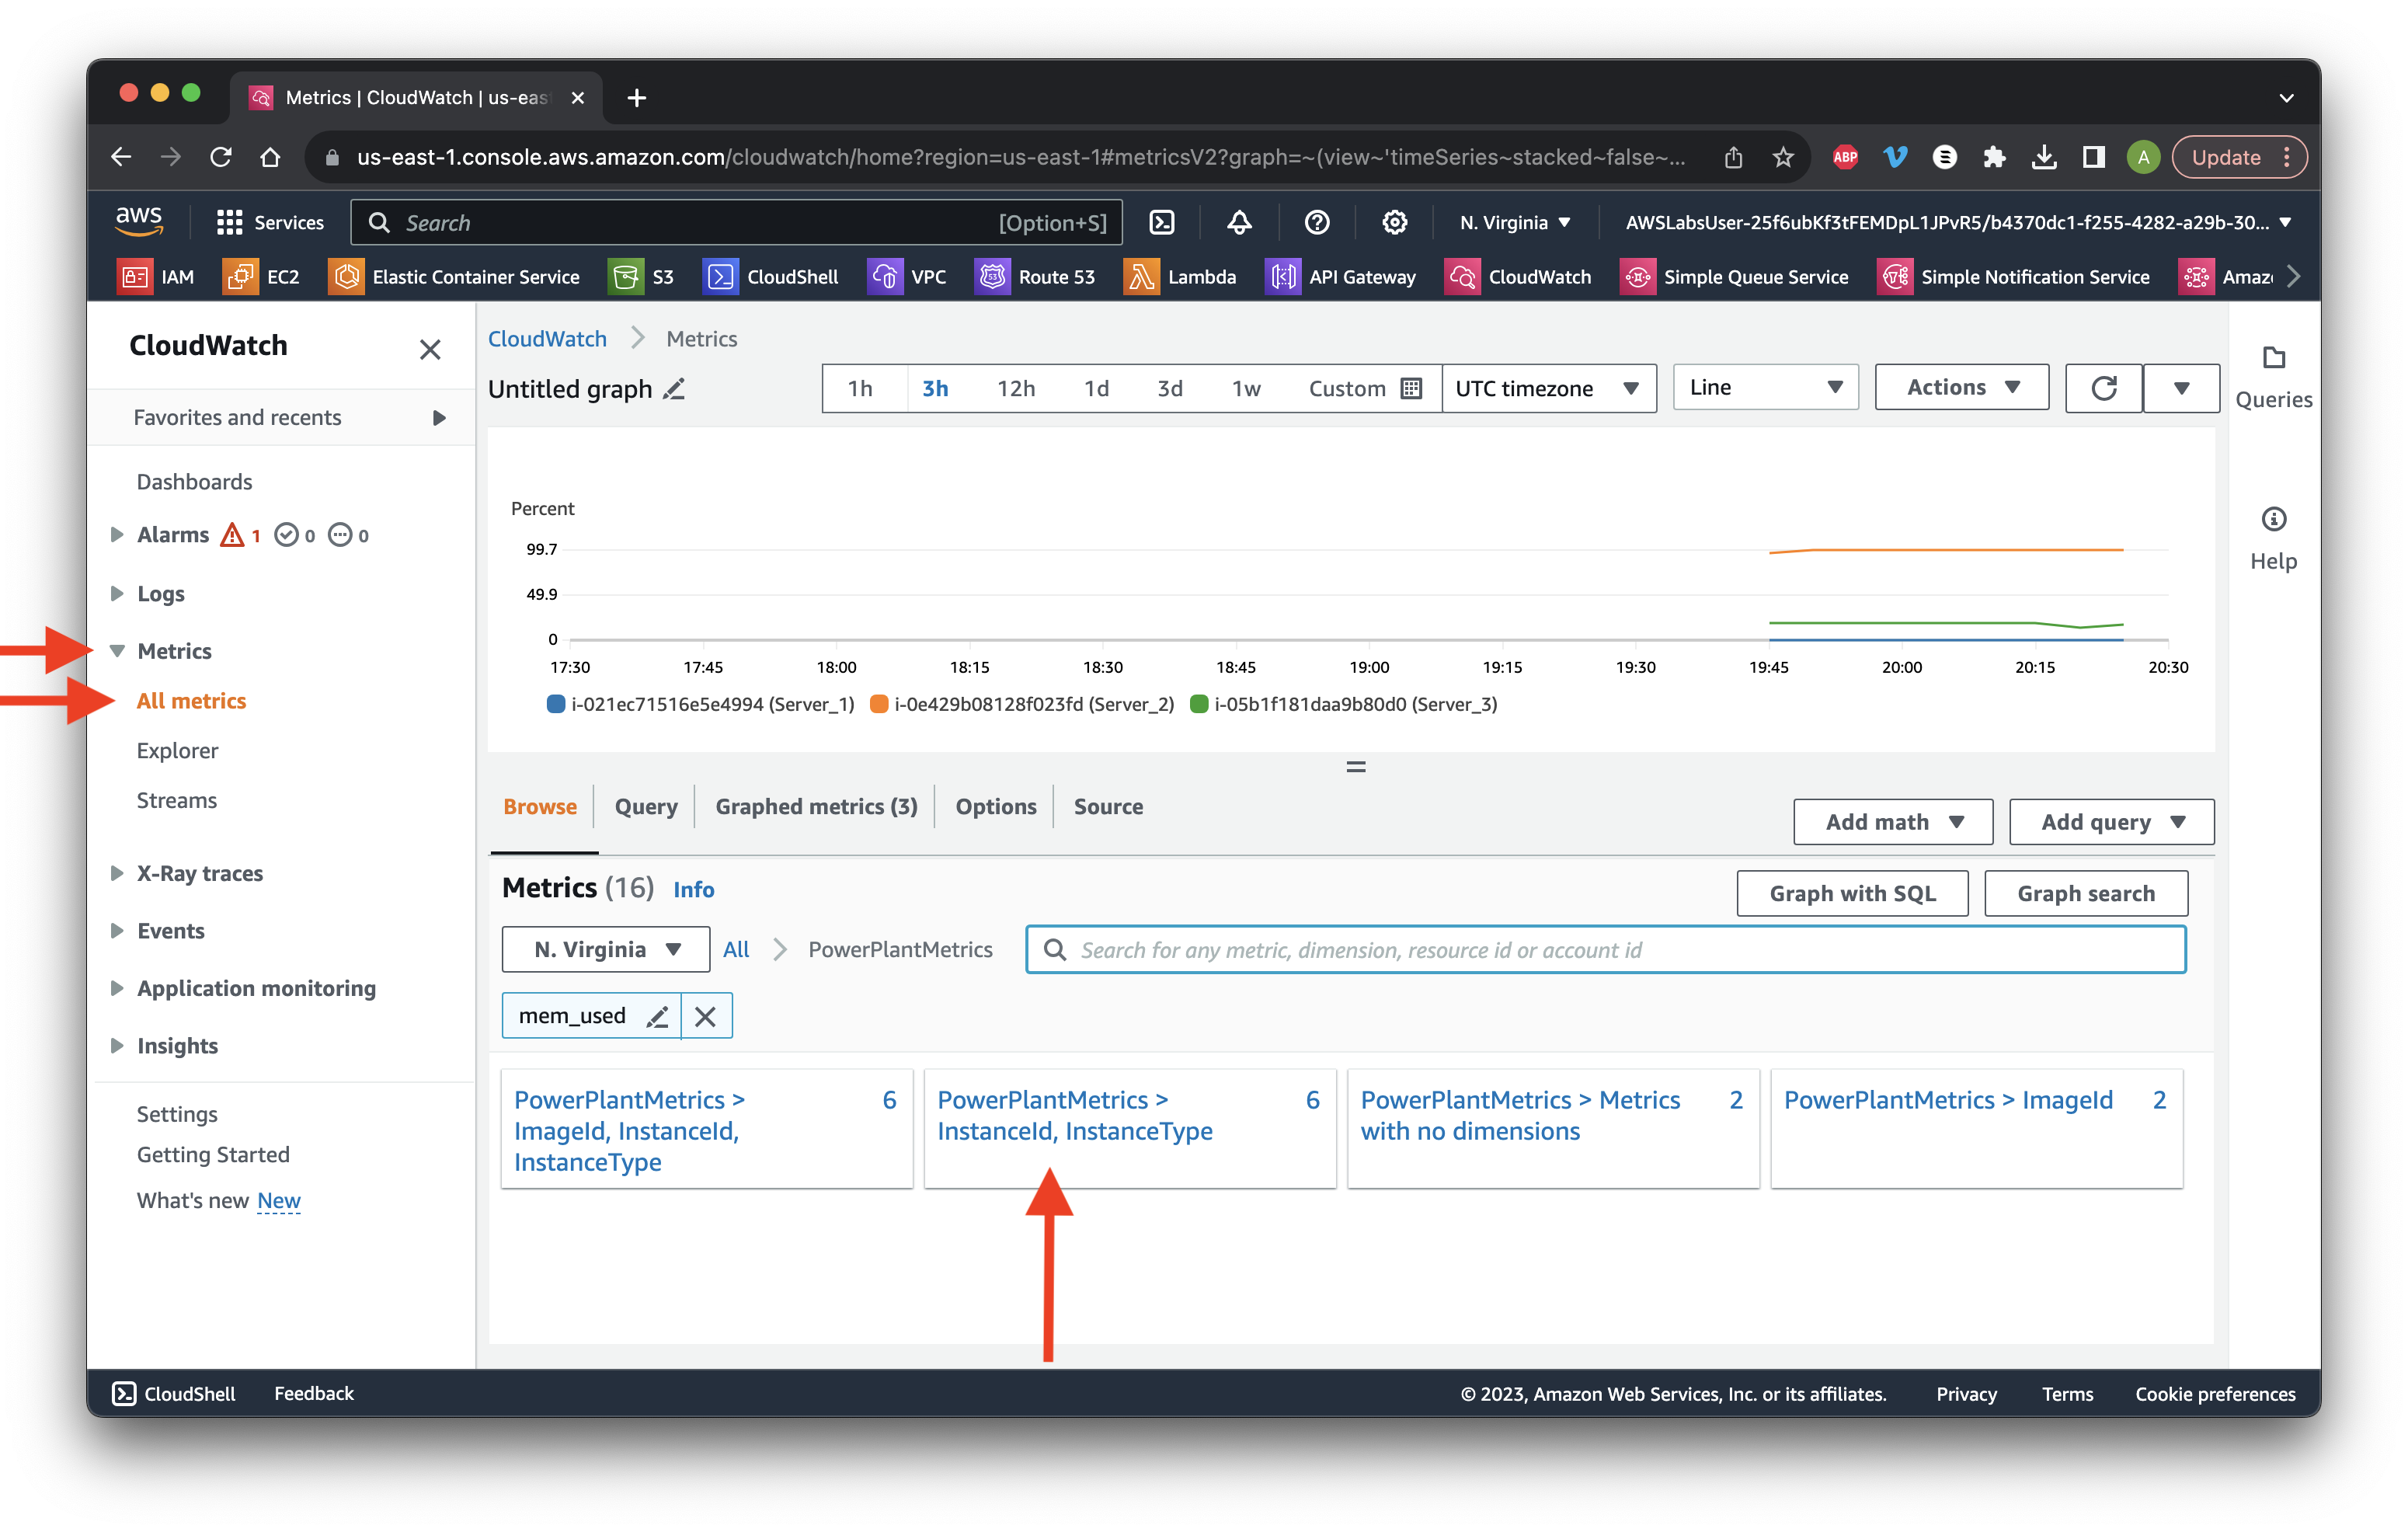
Search for mem_used and select all the instances. Click Actions then Add to dashboard. Select the previous dashboard and change the Widget type to bar. Click Add to dashboard.
Review the graph then click Save.
Go to the Alarms dropdown and select All Alarms. Click Create alarm.
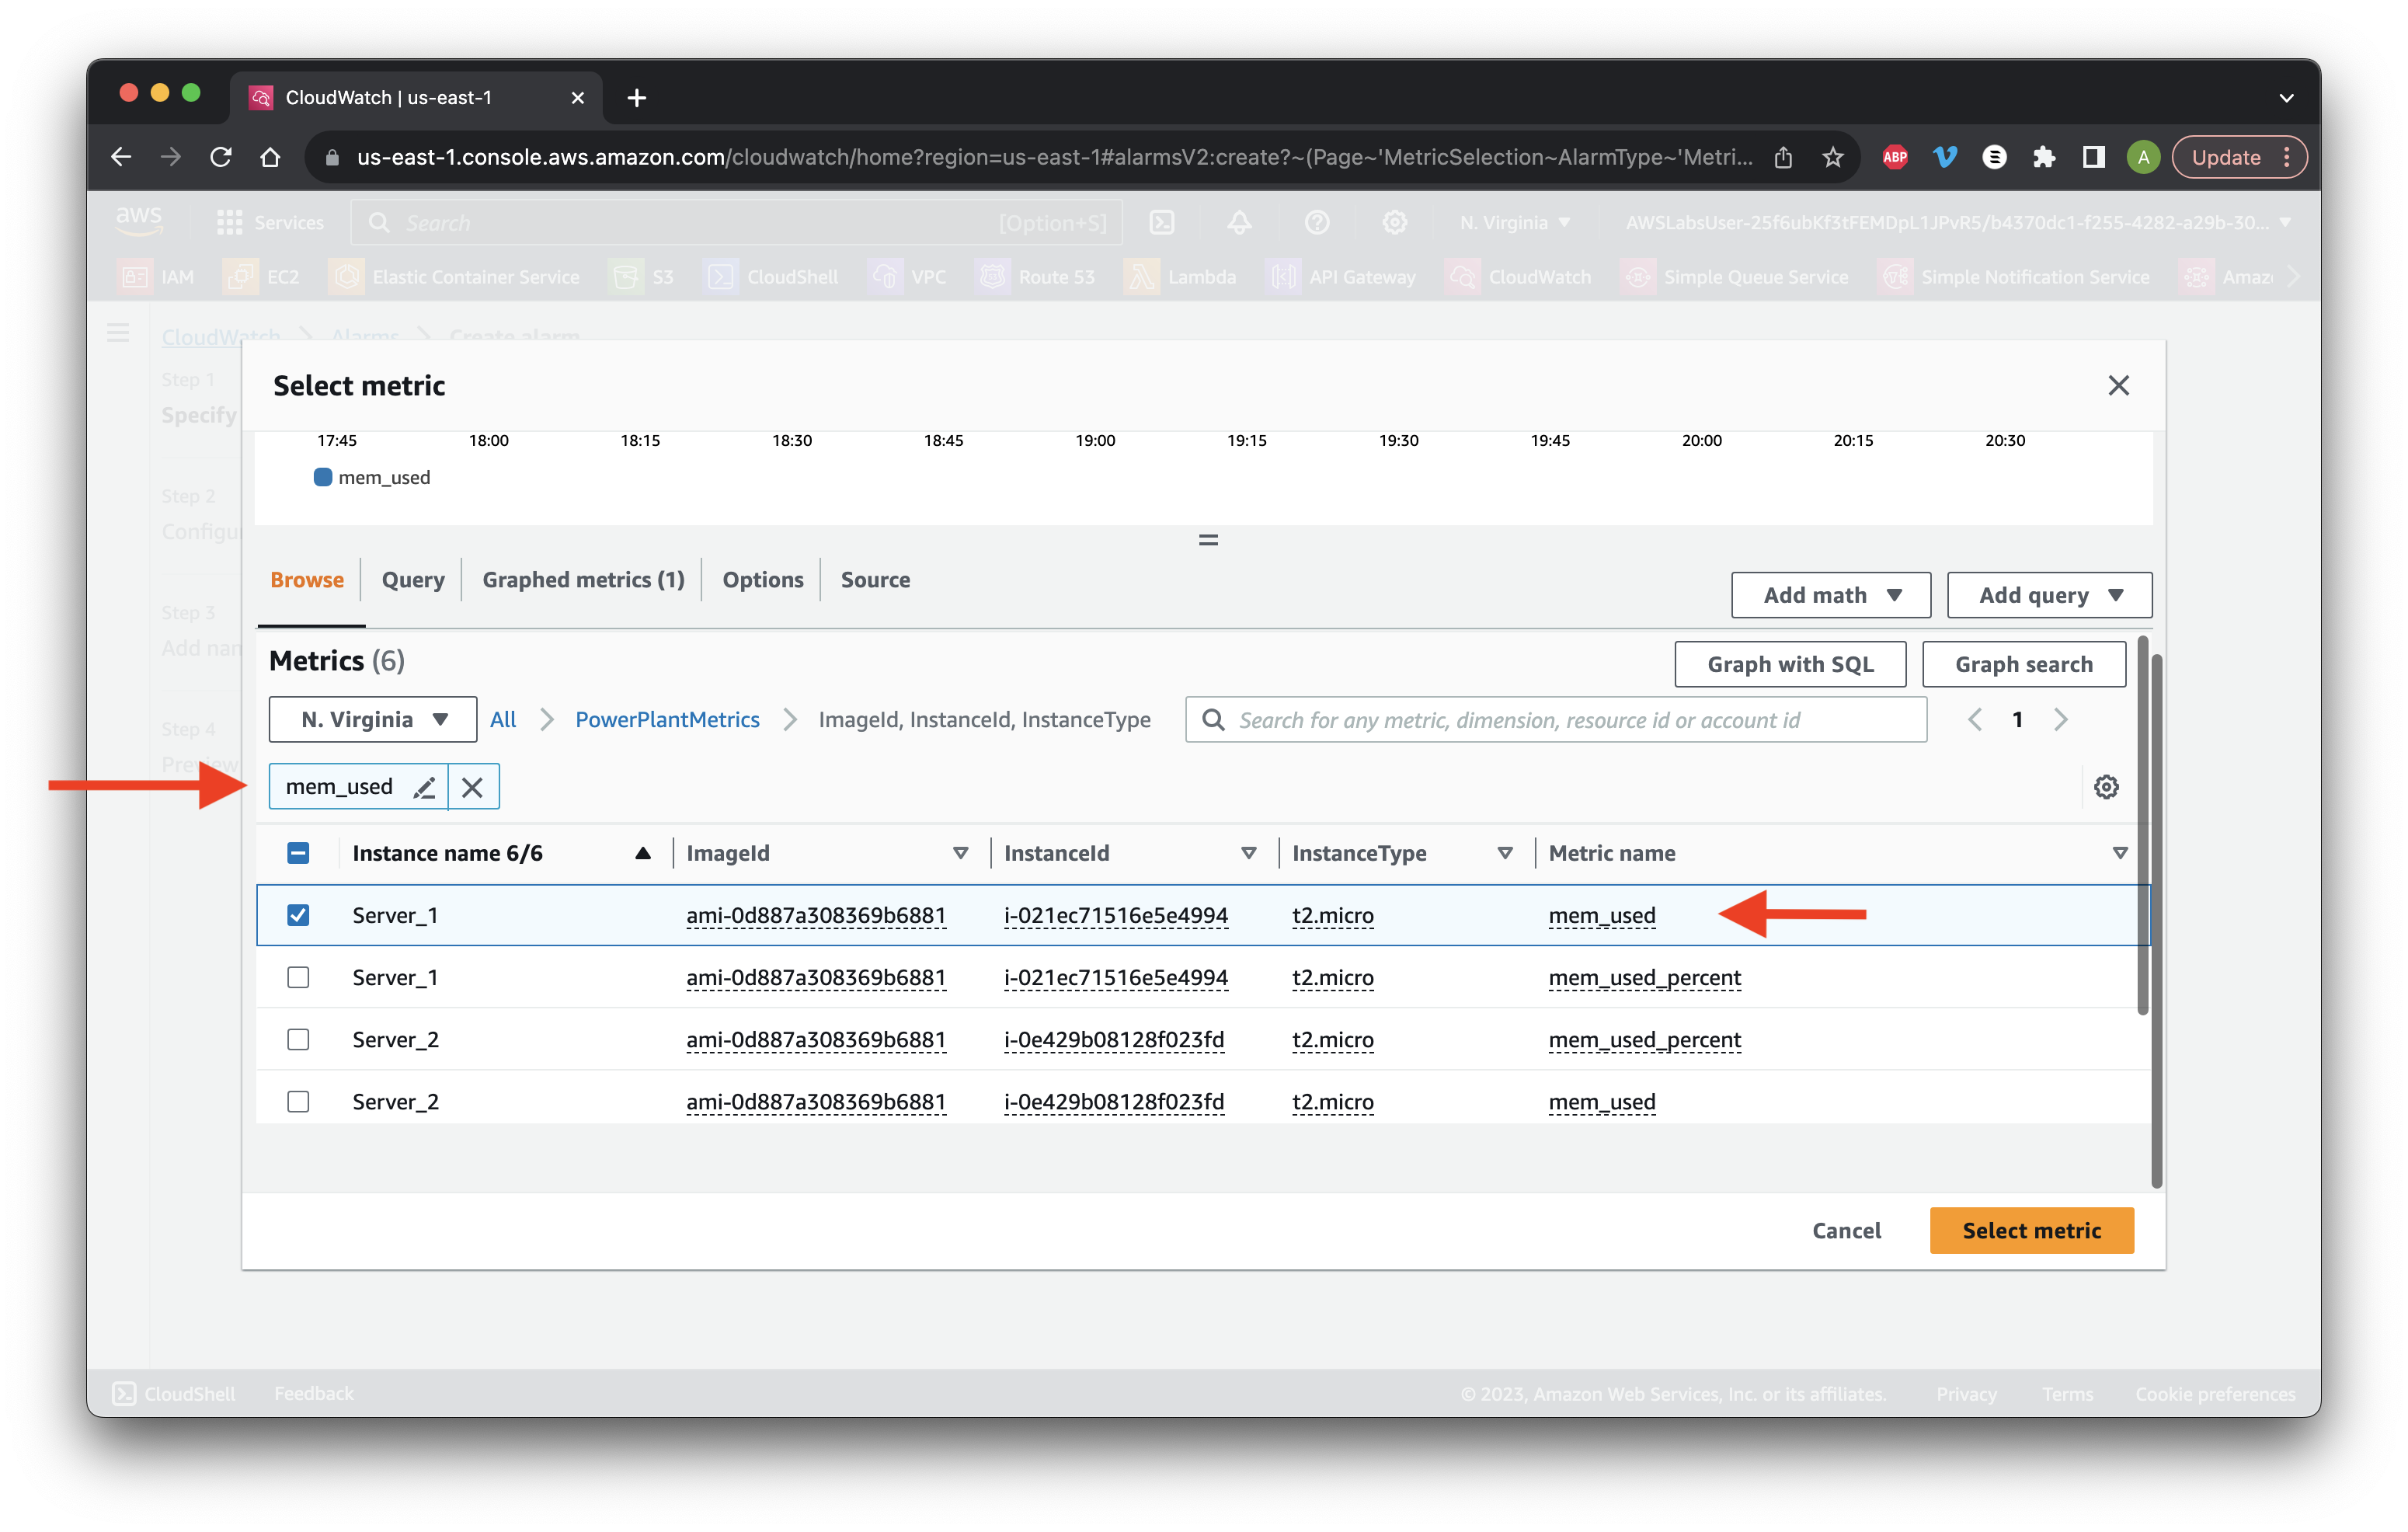
Click Select metric then search for mem_used and click the ImageId, InstanceId, etc. metric.
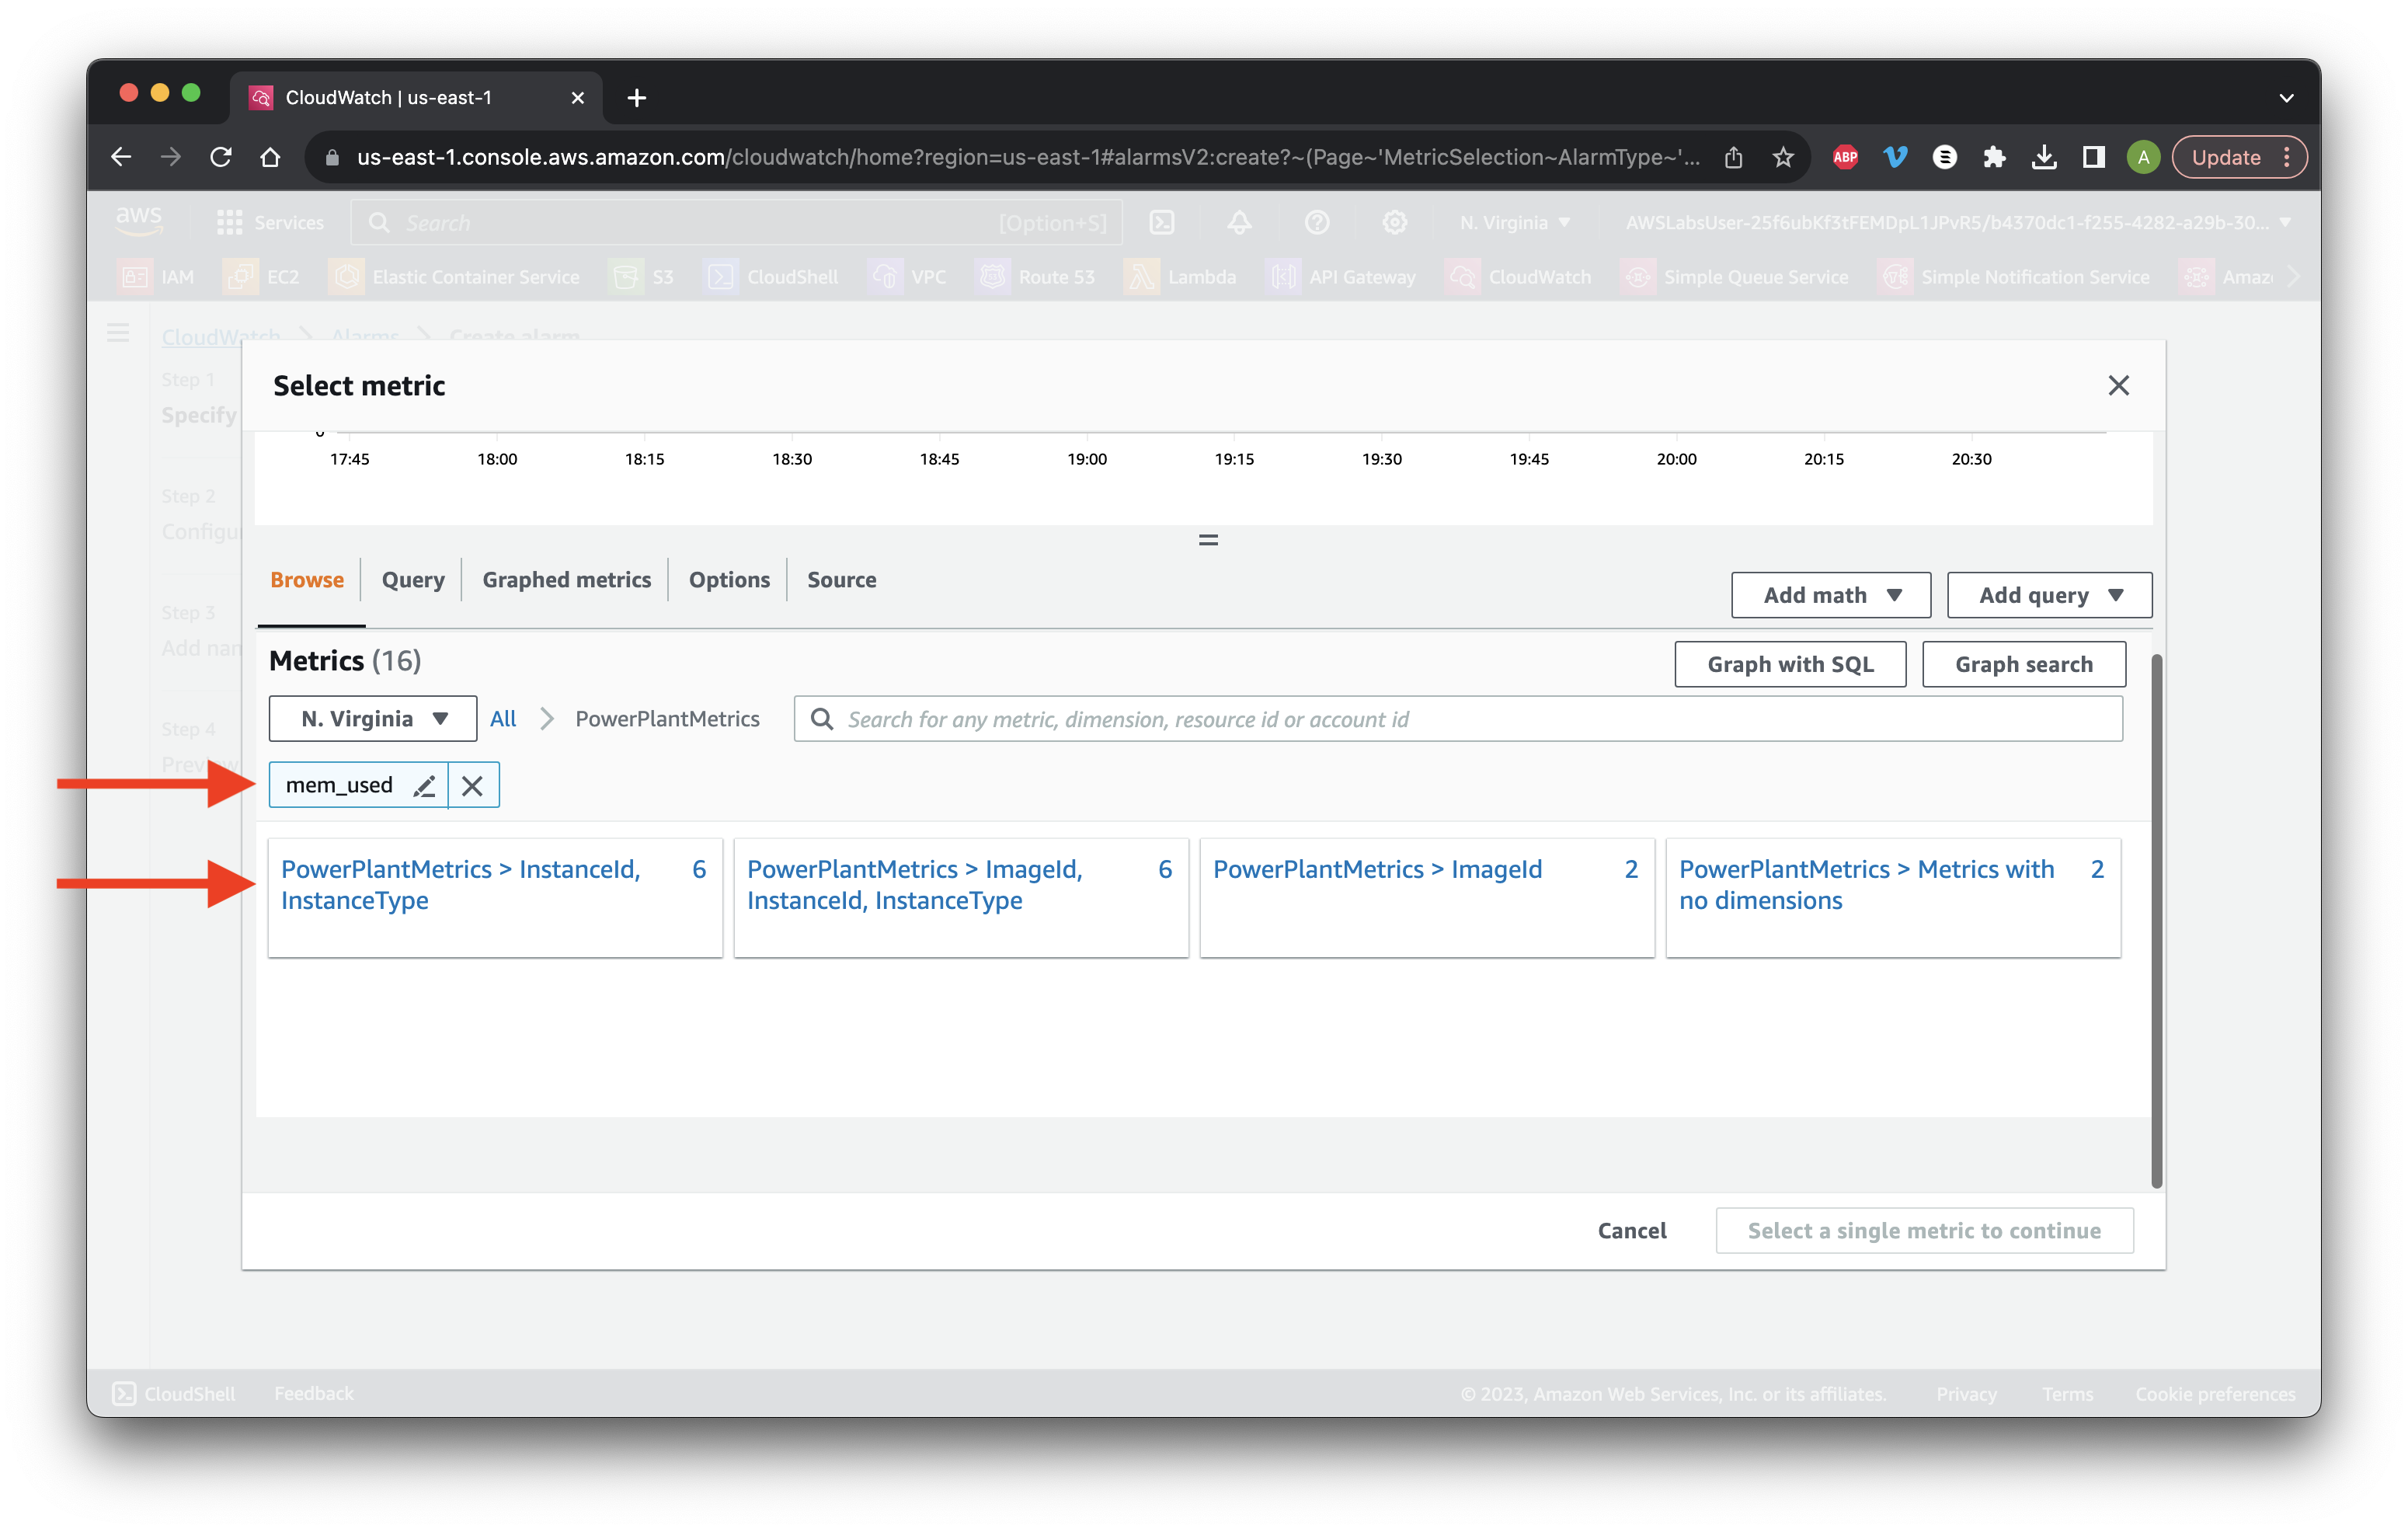
Select Server_1 with mem_used then click Select metric.
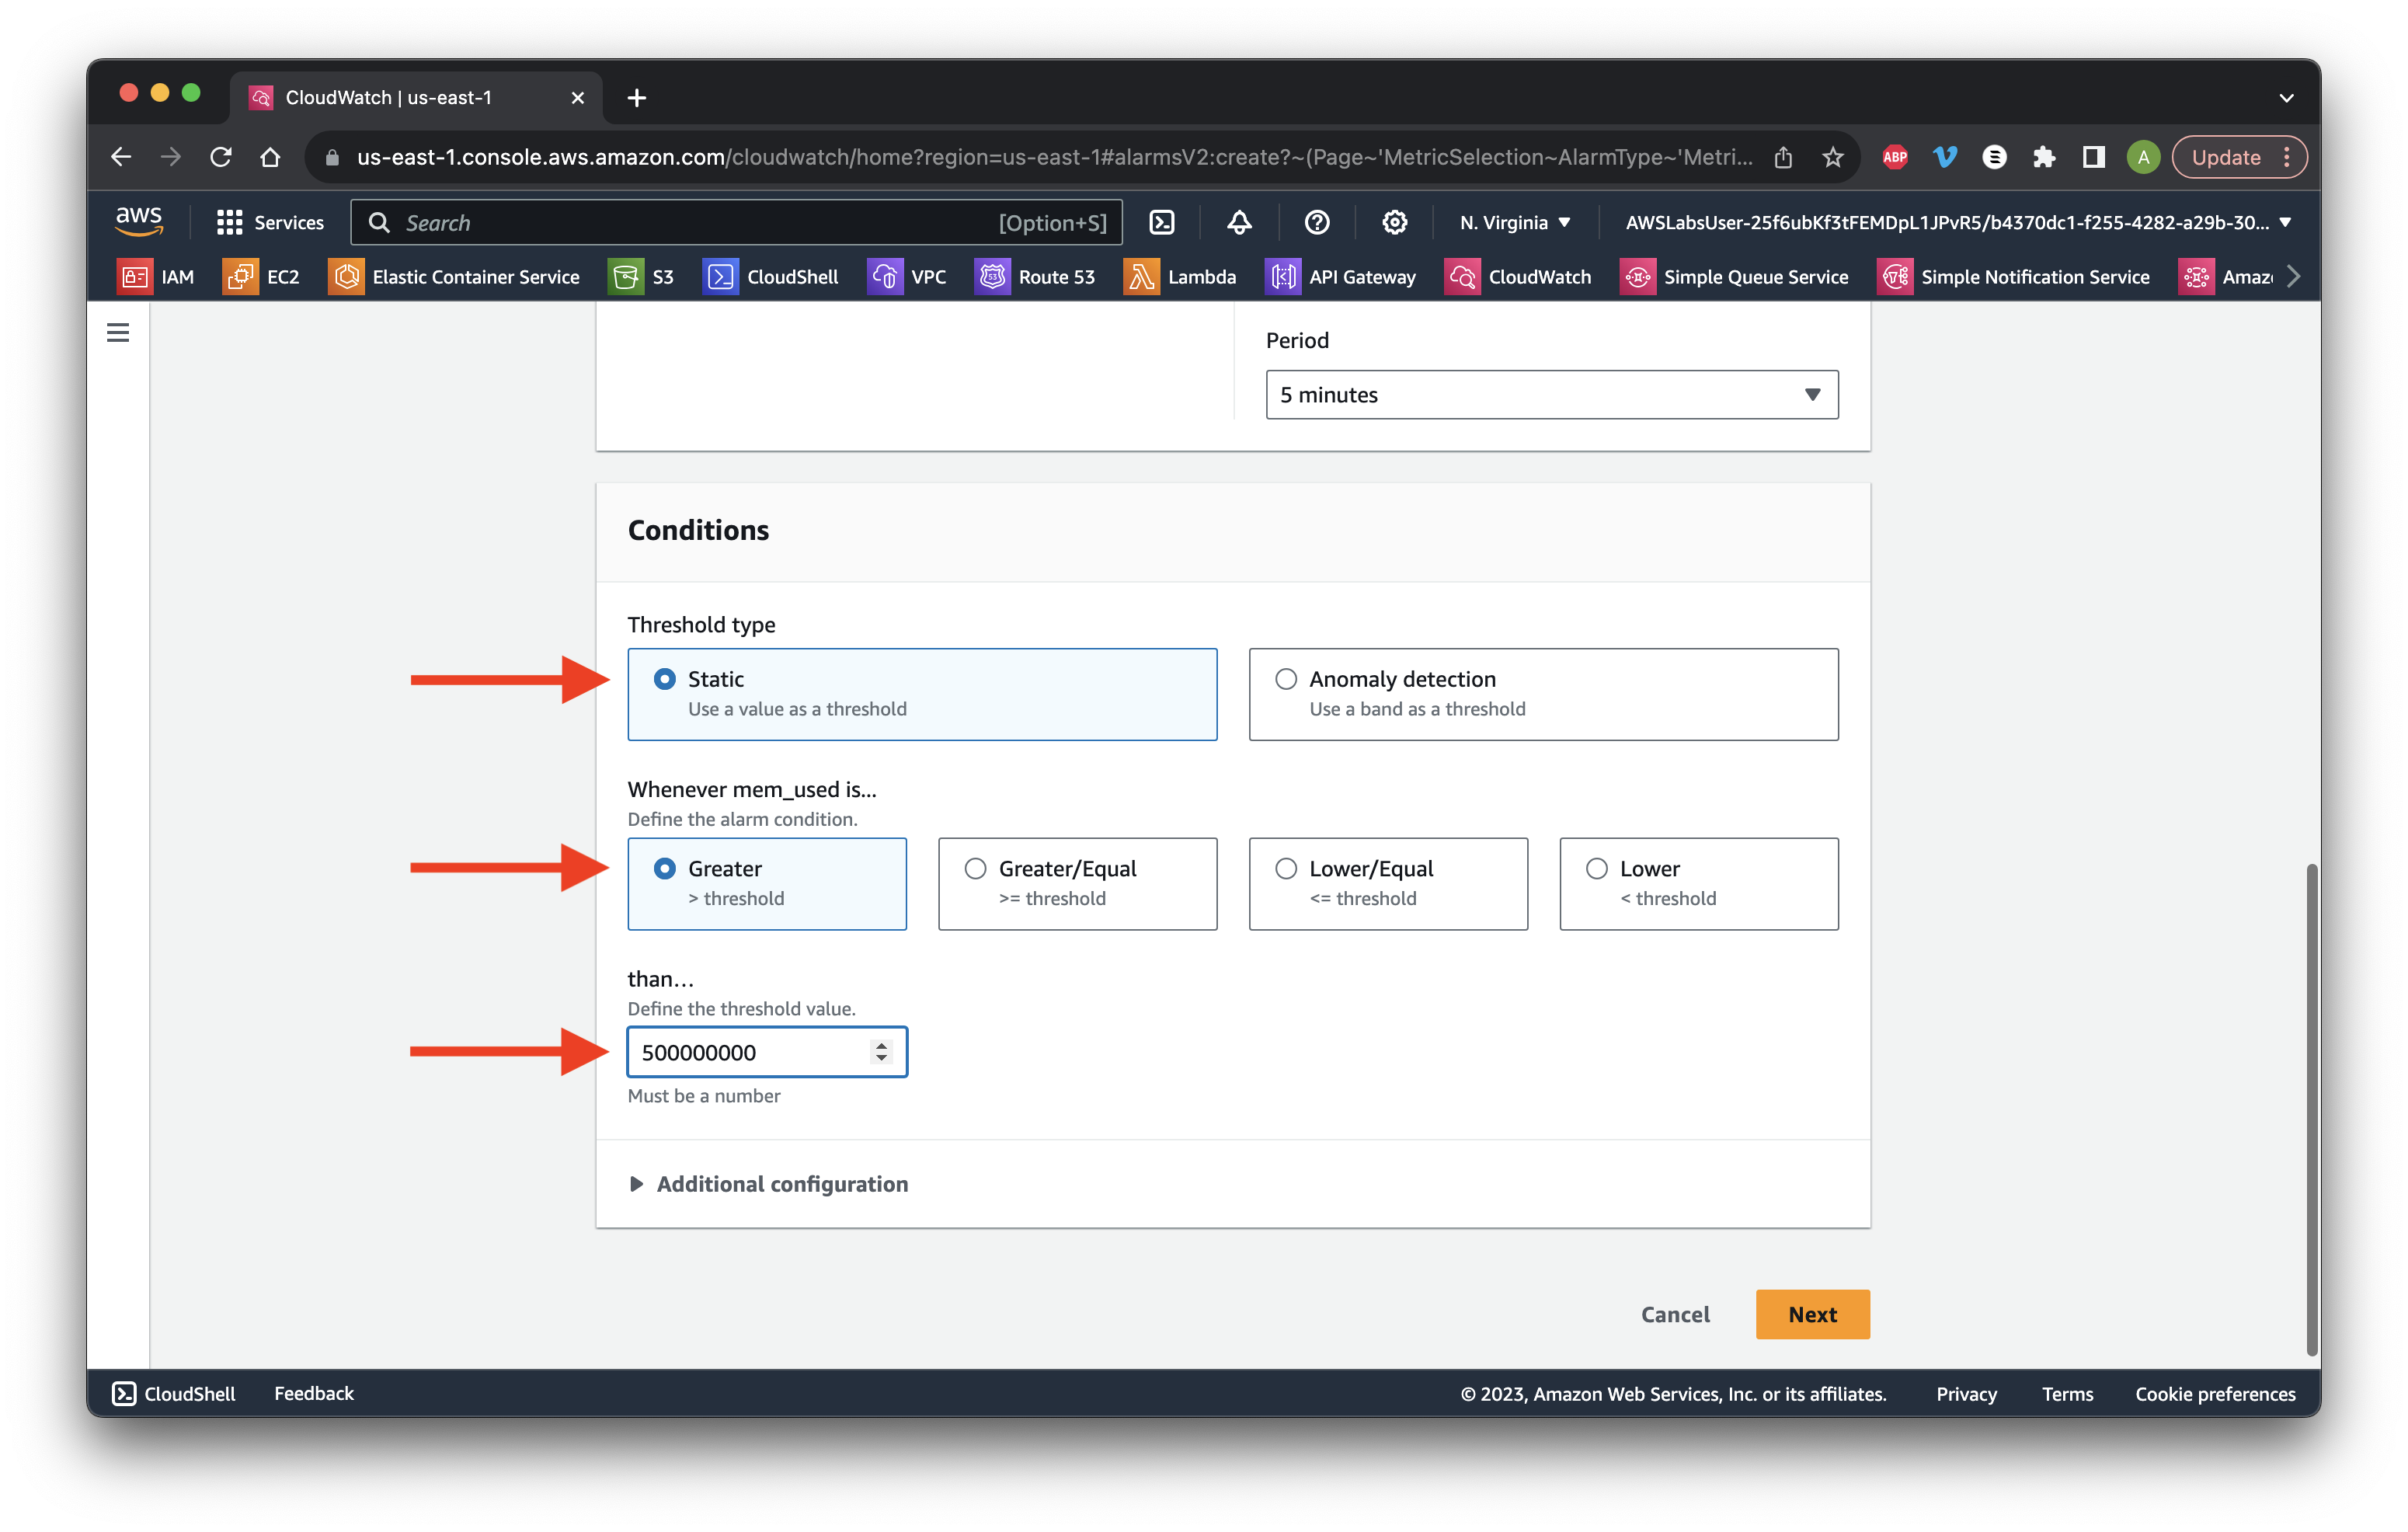
Scroll down and choose a Static Greater than threshold. Define the threshold value as 500M and click Next.
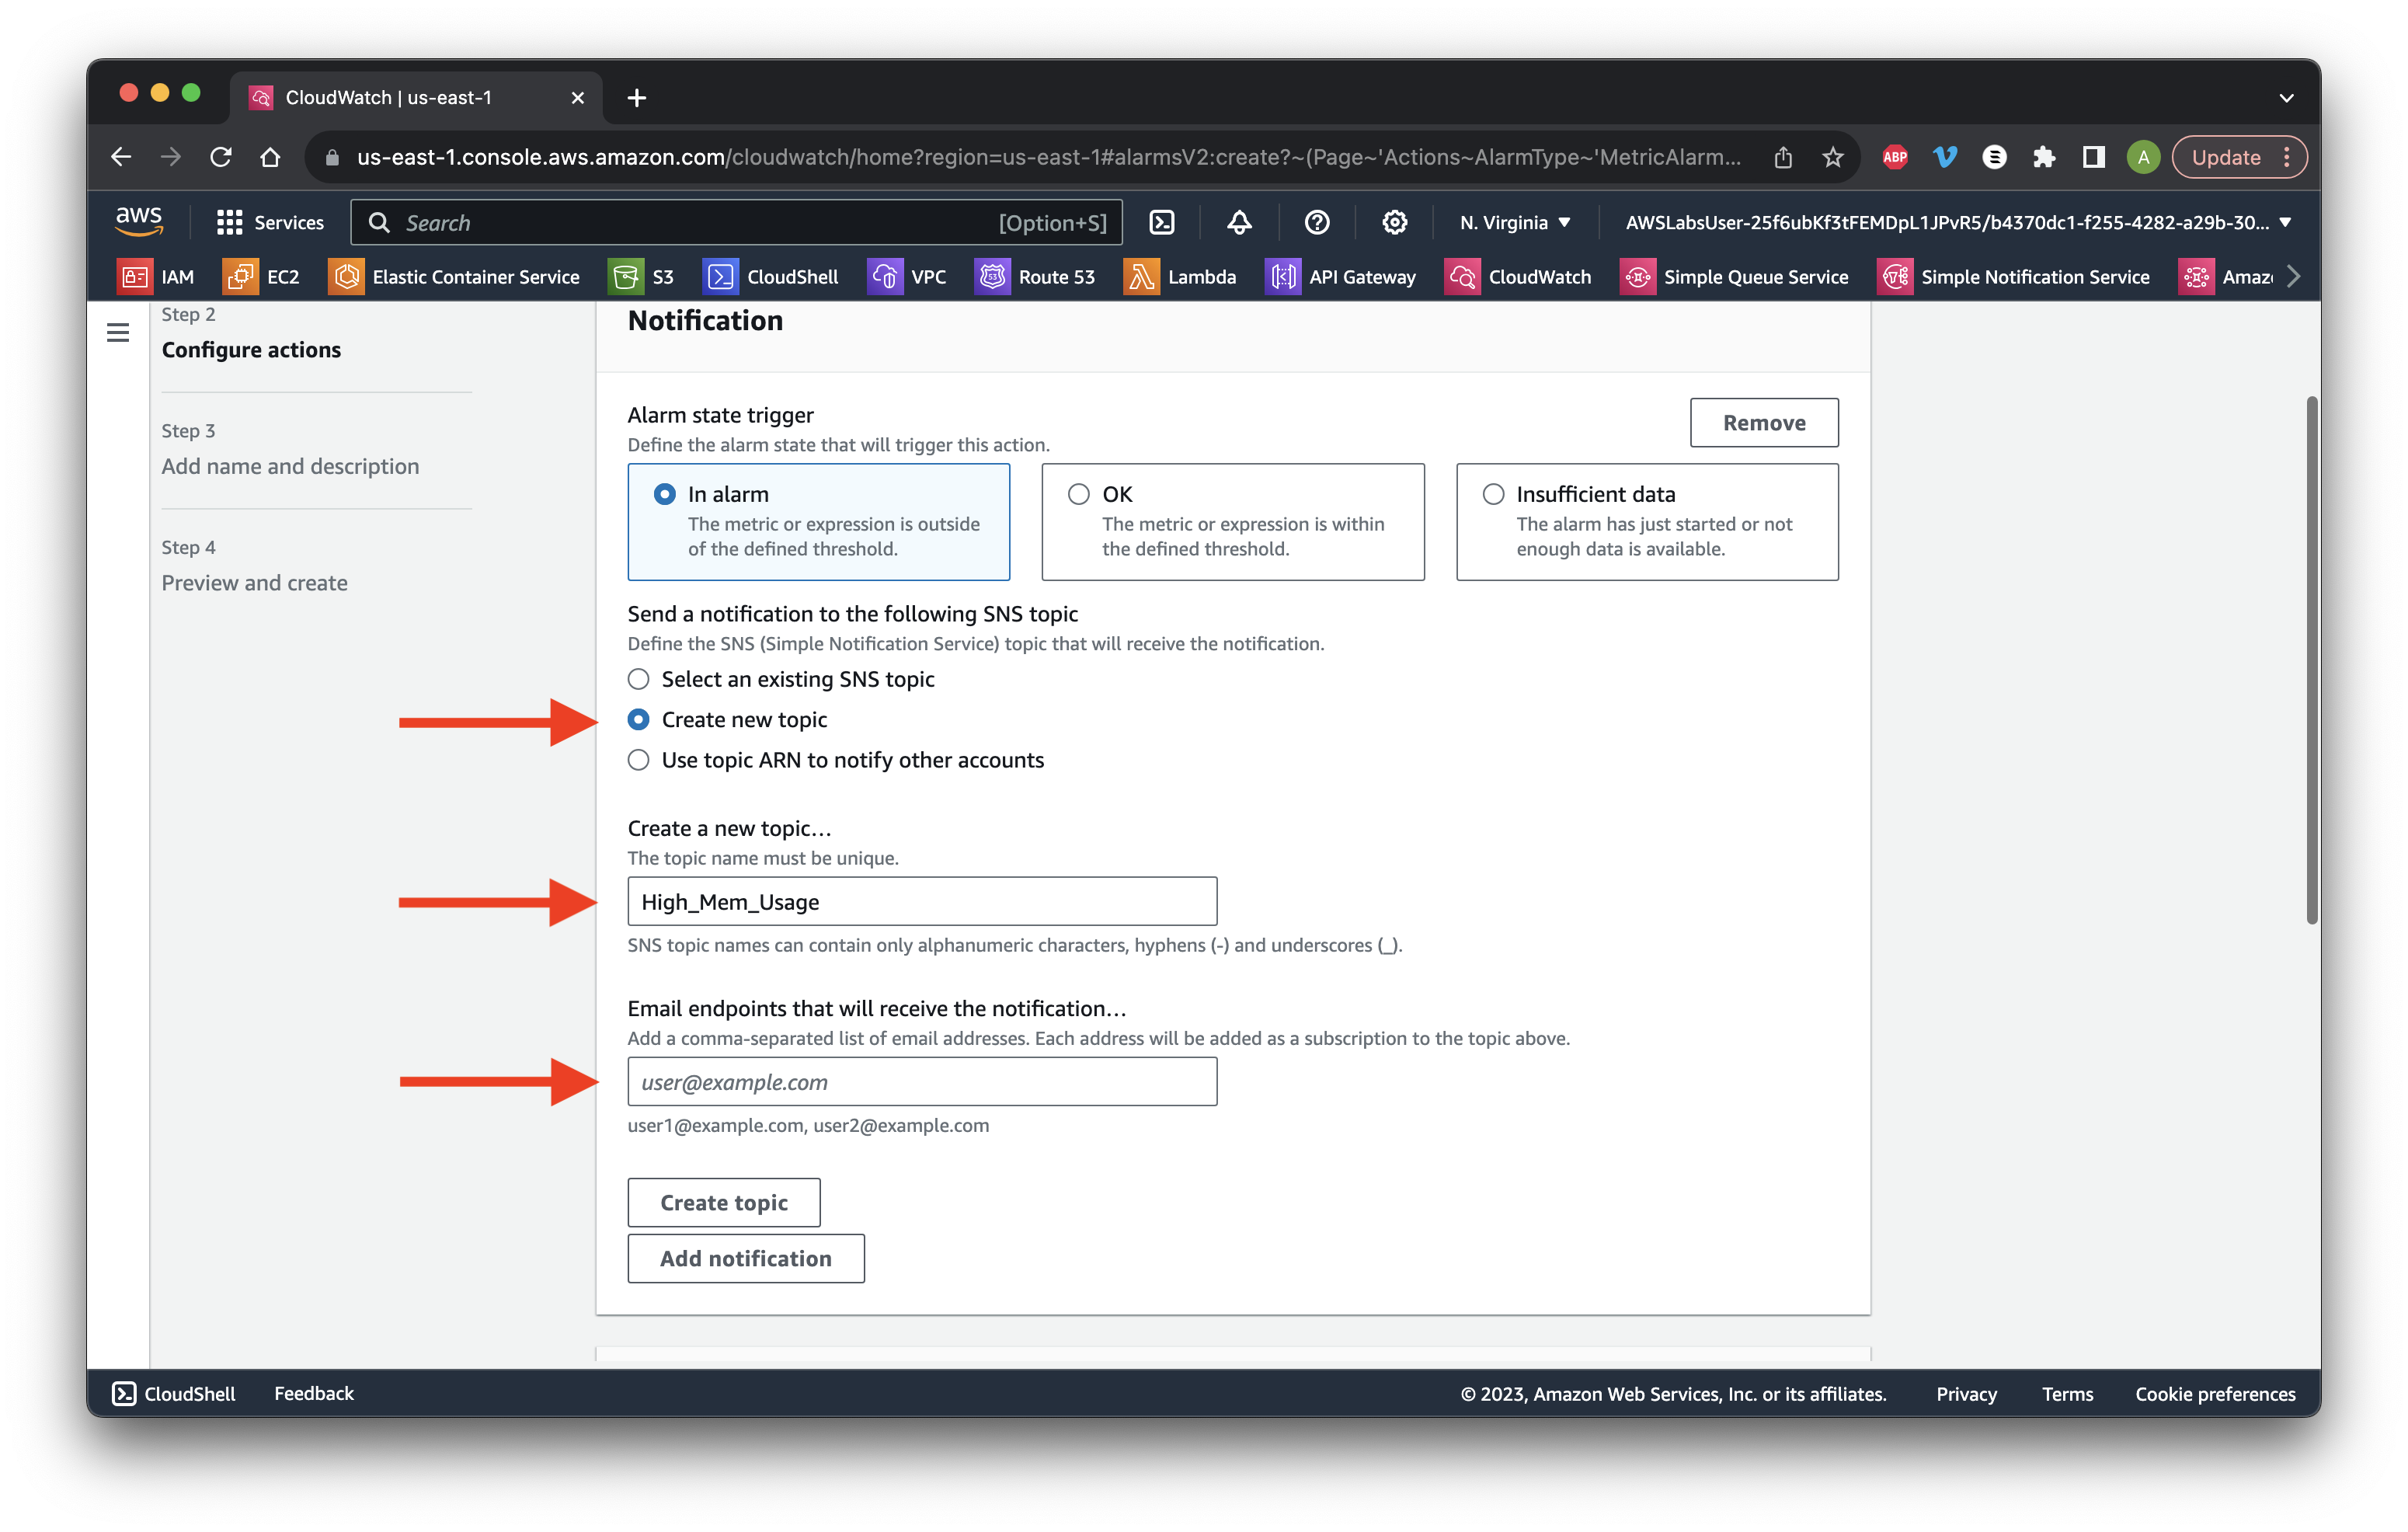
Create a new topic and type High_Mem_Usage. Enter your email to subscribe to the SNS topic. Click Create topic.
Check your email and click the subscription confirmation link.

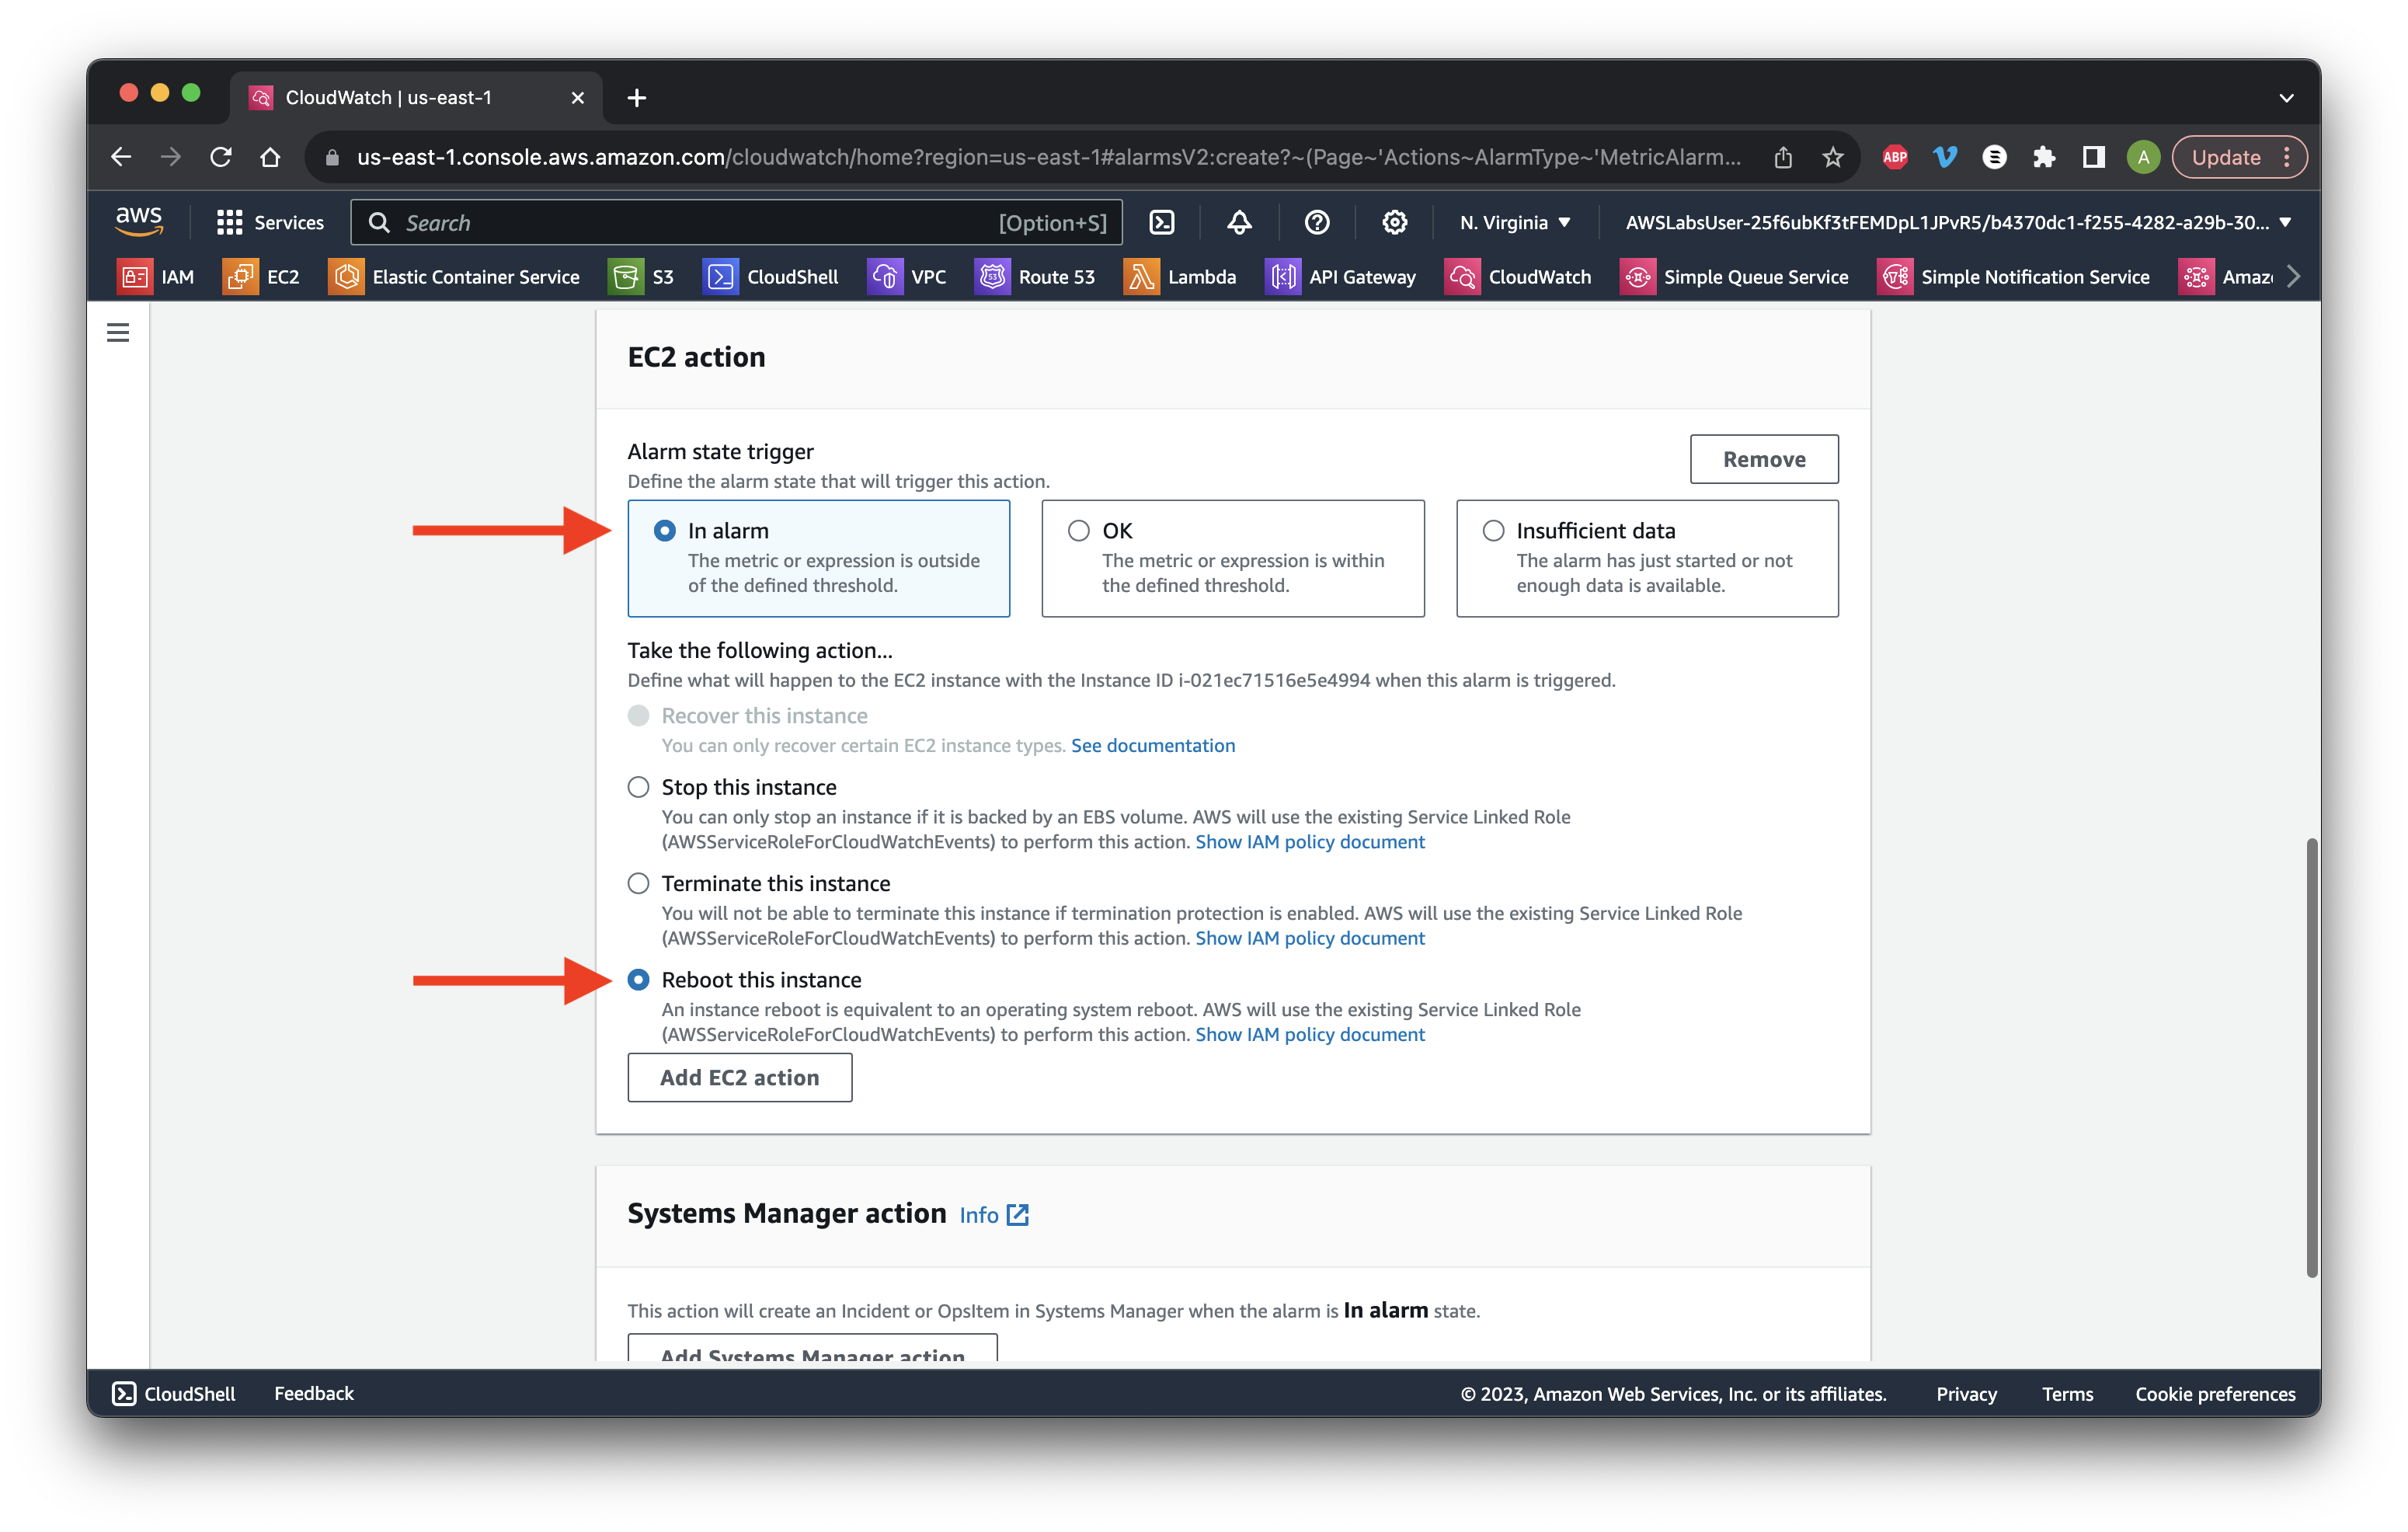
Scroll down and click Add EC2 action. Select the state as In alarm and Reboot instance. Scroll down and click Next.
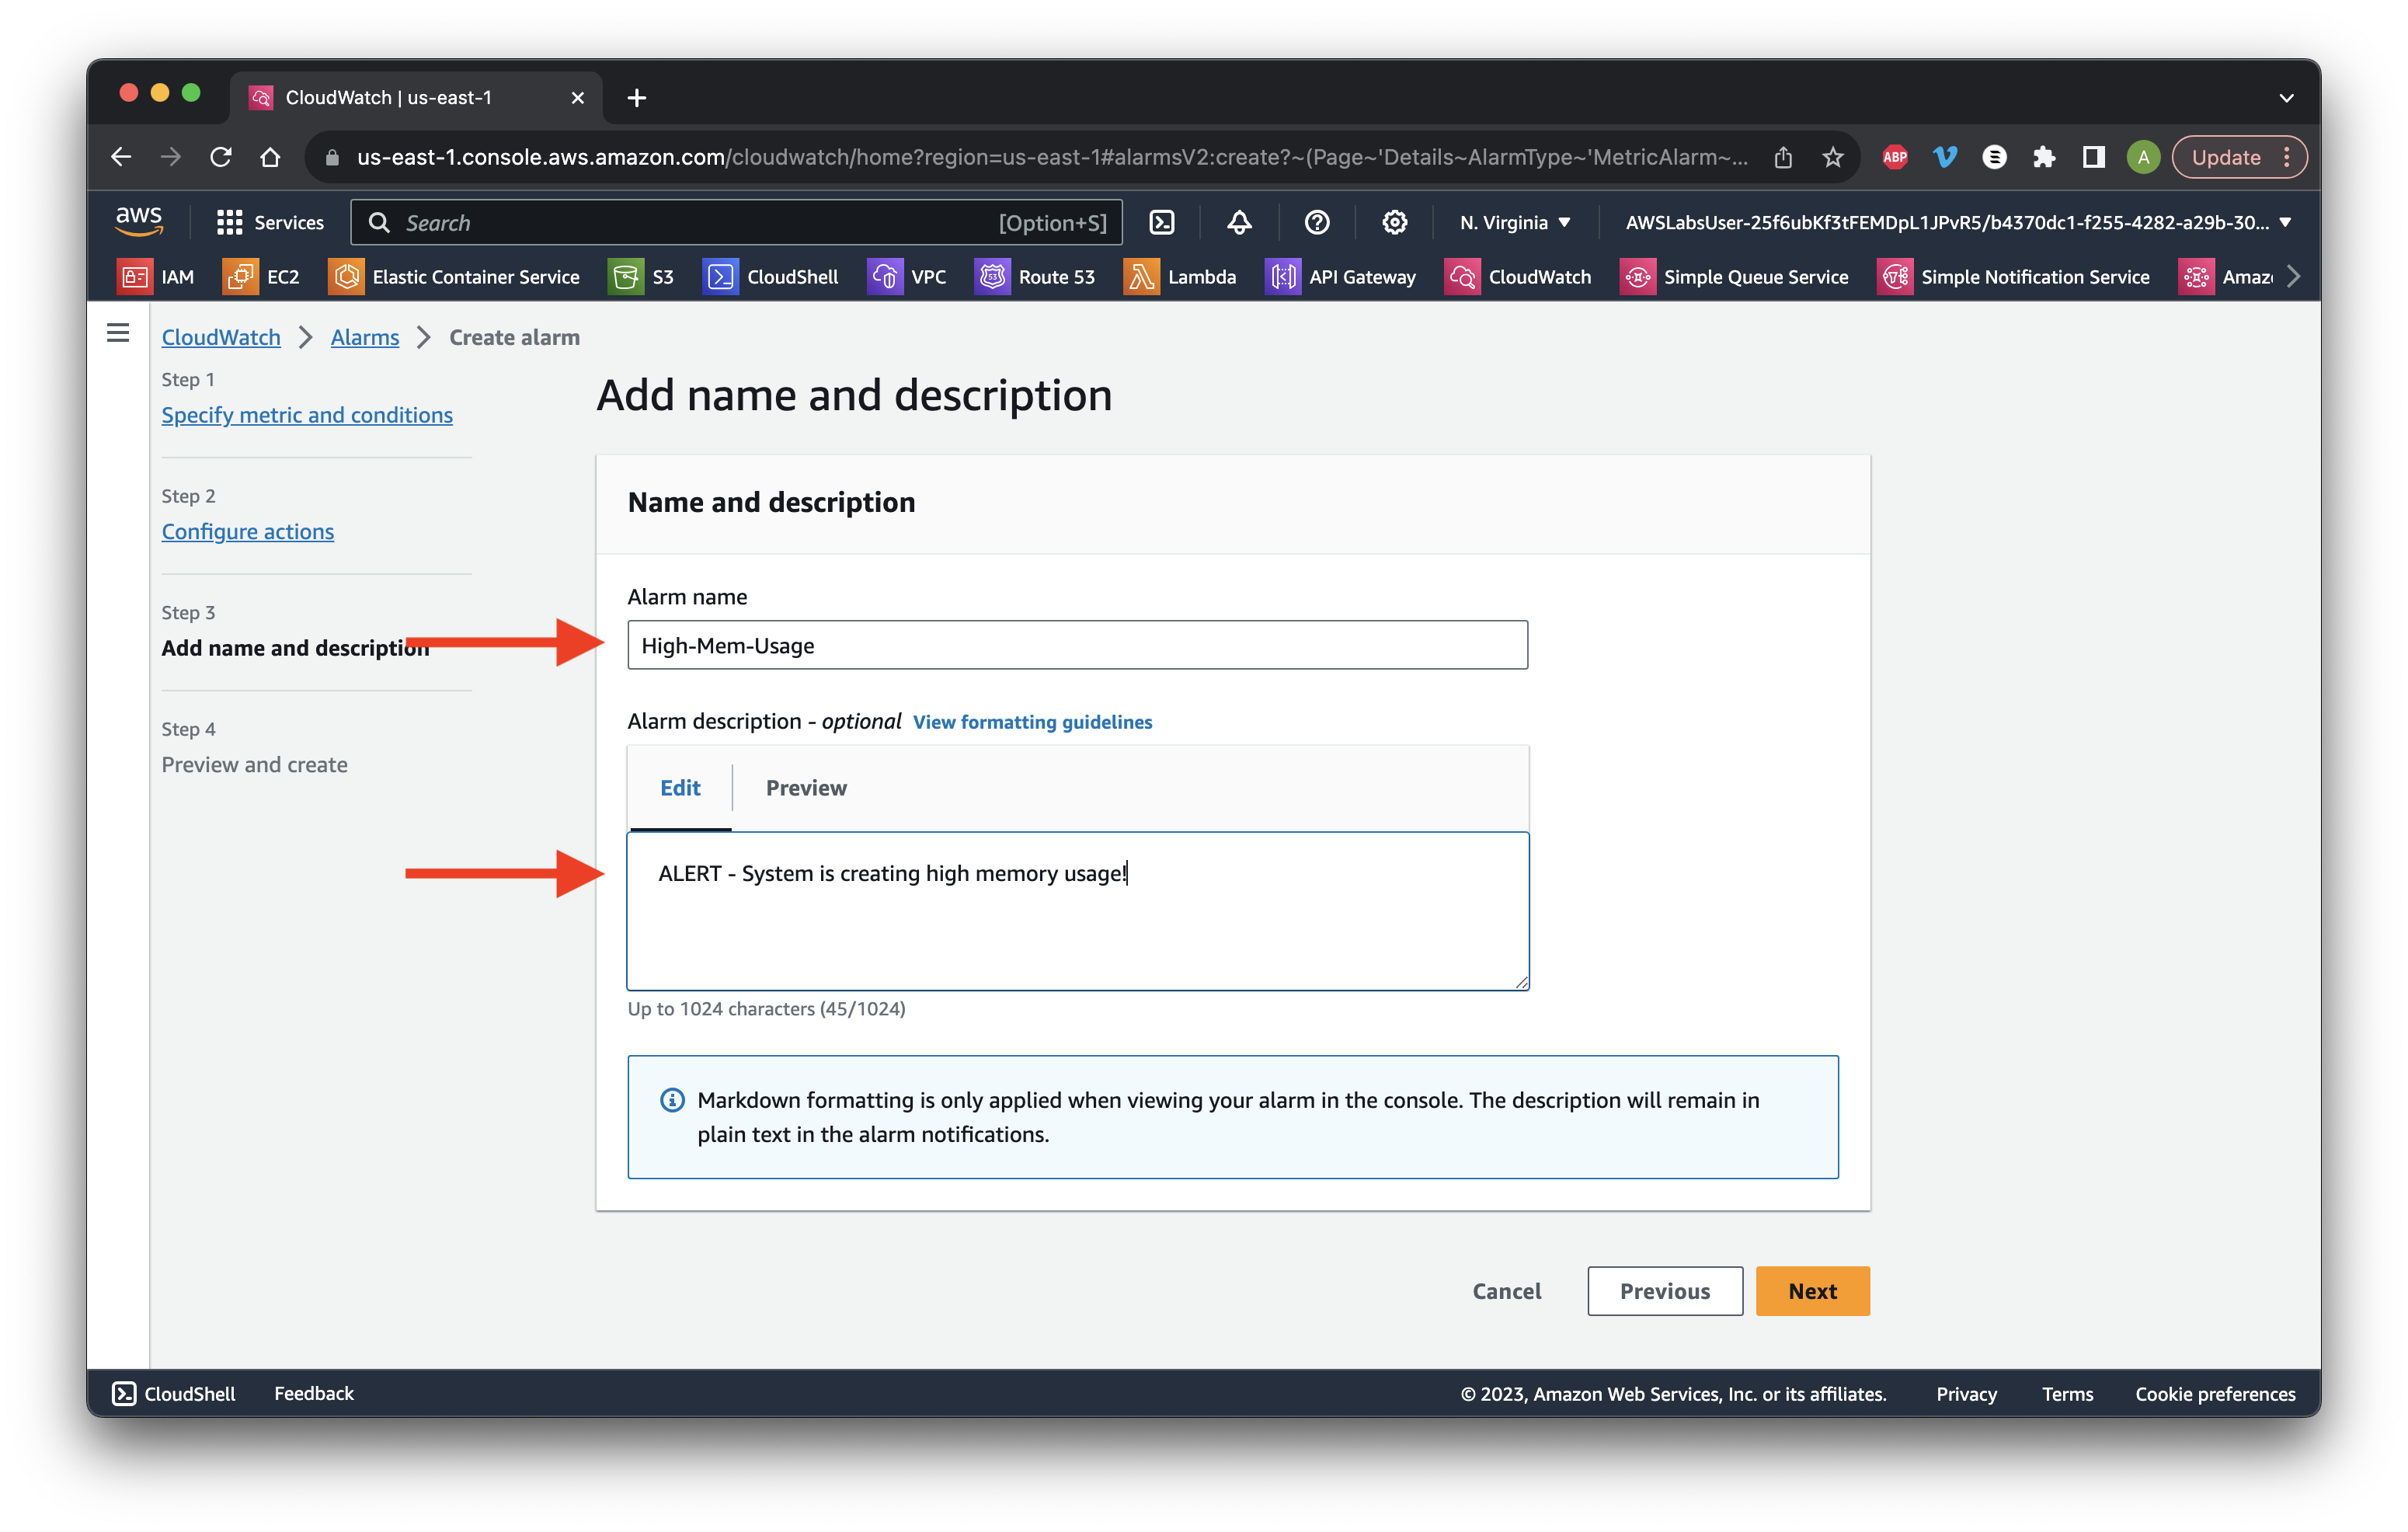
Name the Alarm High-Mem-Usage and type a description. Click Next. Scroll down and click Create alarm.
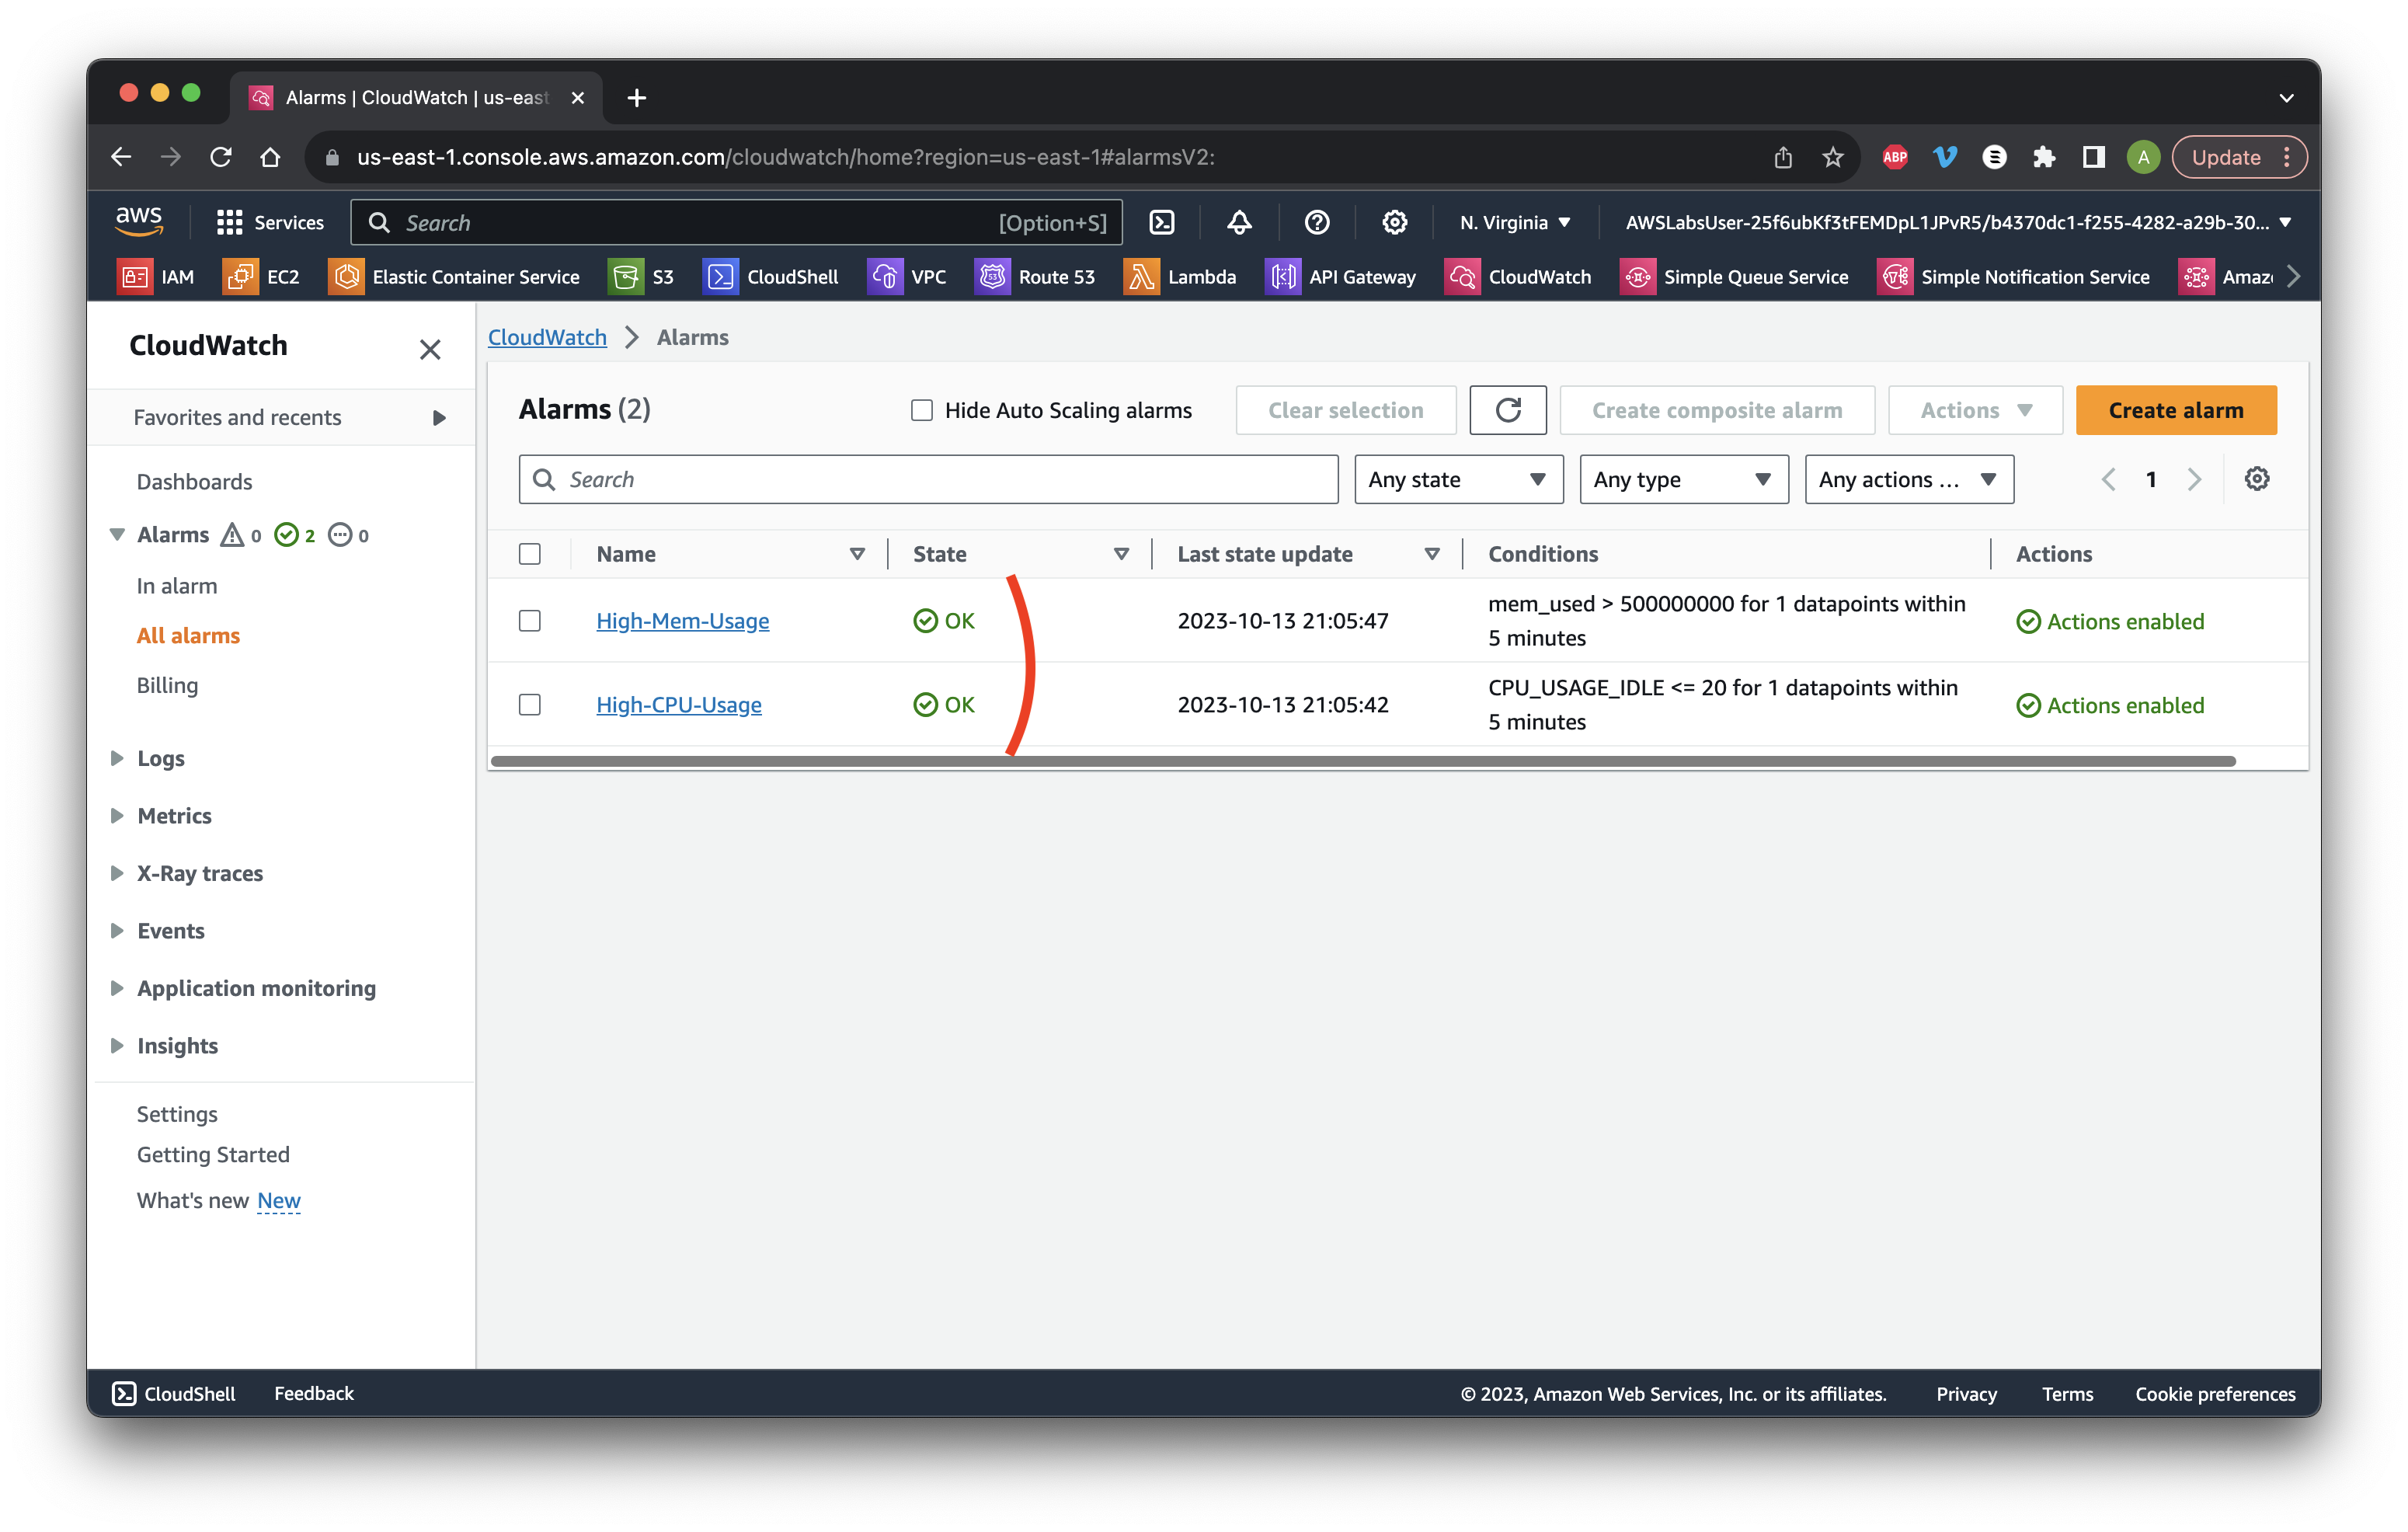
Wait for the State to update and wait for the EC2 instance to reboot, leading to both alarms being in the OK state. Success!